GNIFdb
Help
Neoantigens are antigens that are not expressed in normal tissues but only expressed in tumor tissues, including antigens produced by oncogenic viruses integrated into the genome and antigens produced by mutant proteins. Without negatively screened by thymus, neoantigen has high specificity and strong immunogenicity. Because virus-mediated tumors account for only a small part of all tumor types, neoantigens derived from mutations become the most ideal target for immunotherapy. We developed GNIFdb, a database collected neoantigen information of different cancer and provided several bio-information tools, to meet the urgent demand of neoantigens in cancer immunotherapy. Users can upload their own neoantigen data, which can be showed in GNIFdb after being reviewed by back-end personnel.
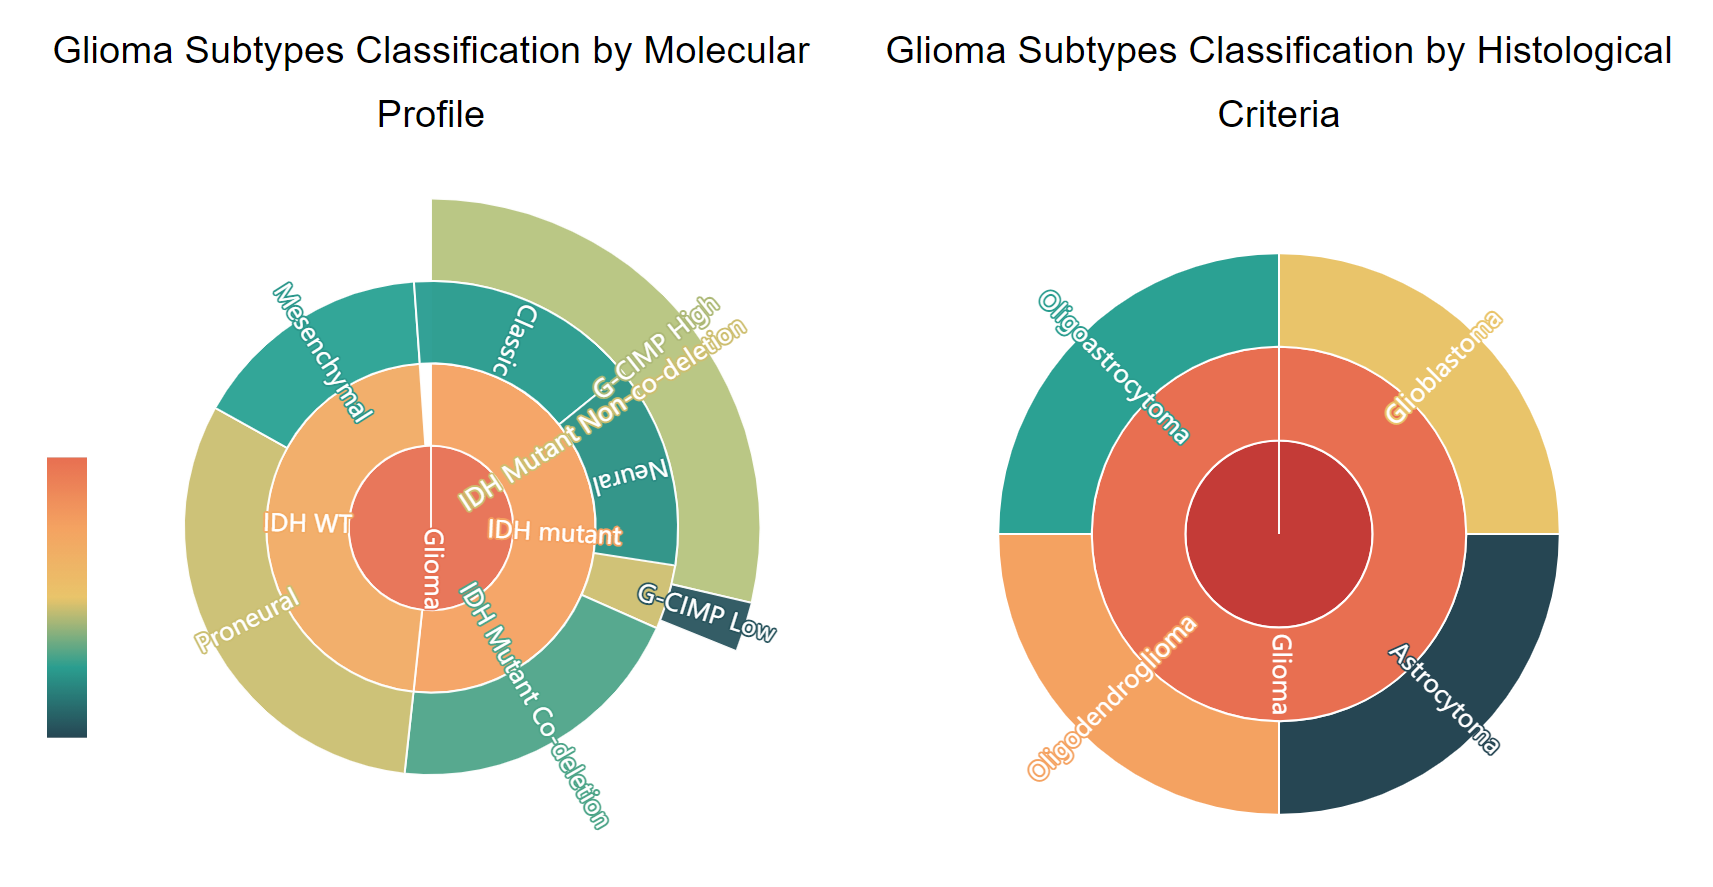
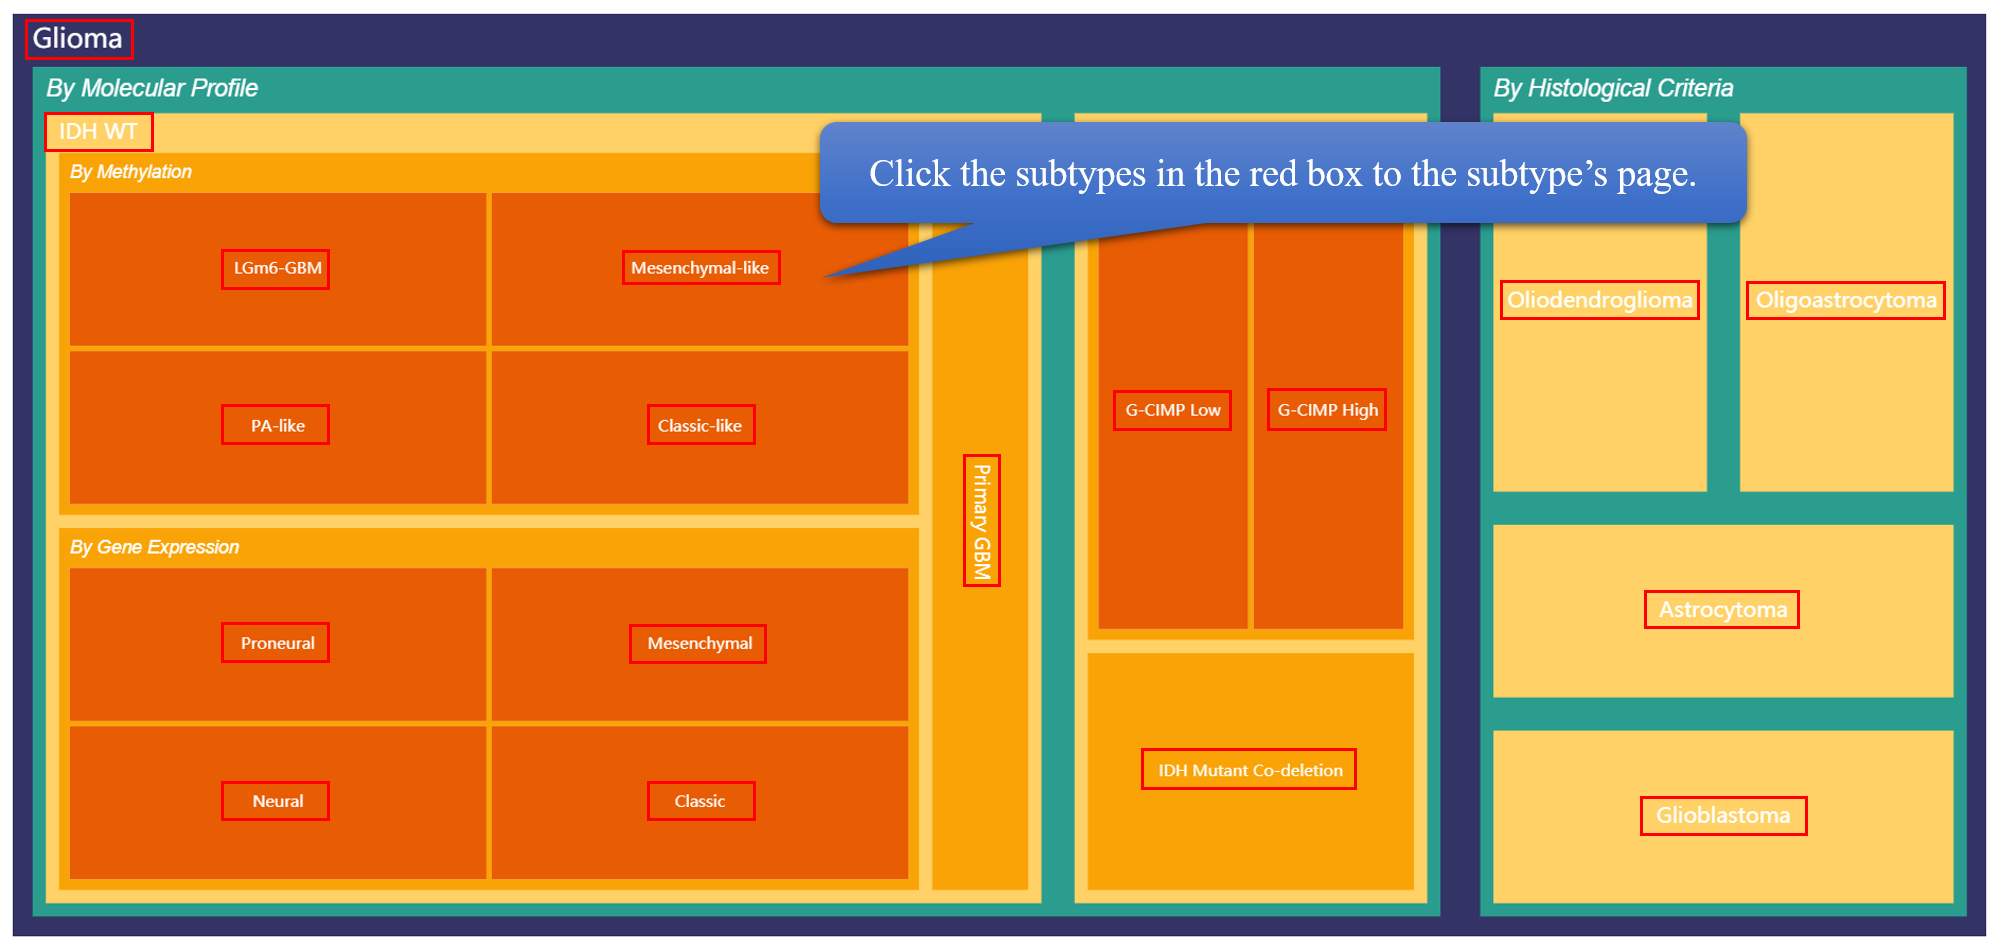
GNIFdb contains information on four different cancer neoantigens from multiple datasets, mainly neoantigen information from glioma. GNIFdb provides gene expression data of TCGA dataset and survive time of glioma neoantigens. For each neoantigen, we calculated its wild type peptide score and mutant peptide score by netMHCpan 4.0. The glioma neoantigen from TCGA is divided into 19 different subtypes by molecular profile and histological criteria. The sunset figure shows different subtypes' distribution of TCGA dataset, while users can click on different targets to understand their relationship.
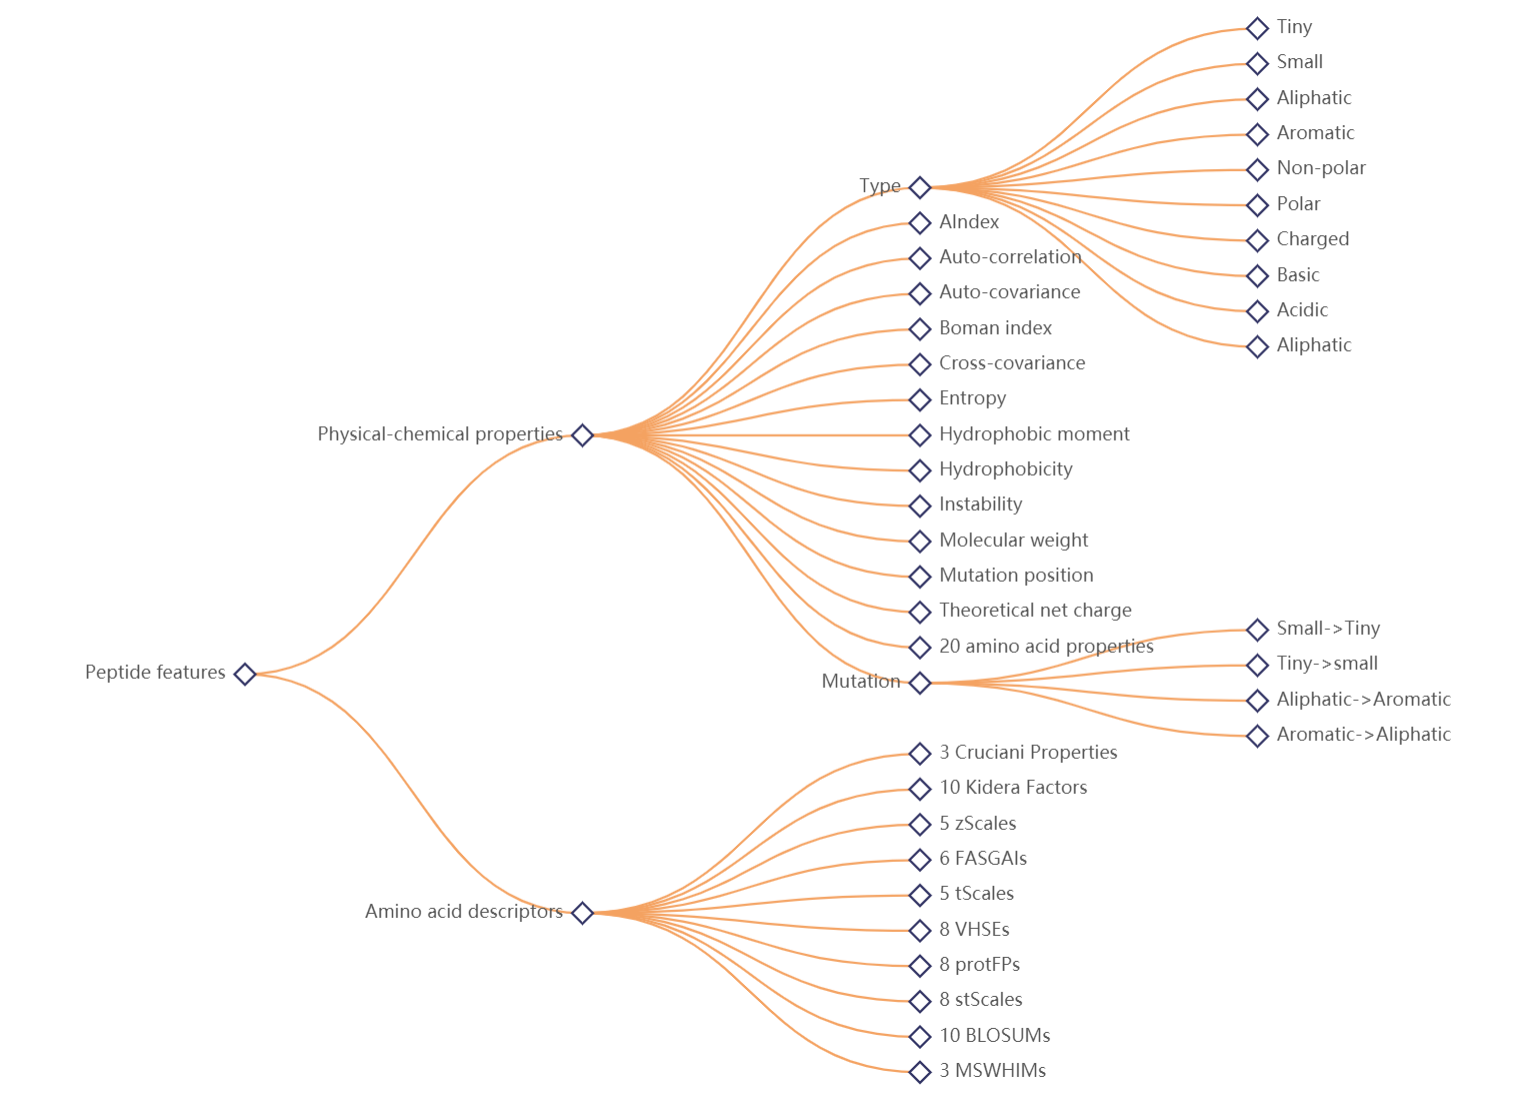
We calculated amino acid descriptors(protFP, blosumIndice, cruciani Properties, FASGAI, MSWHIM, kidera Factor, stScales, T-scale, zScales, VHSE) and physical-chemical properties (aliphatic, auto-correlation, auto-covariance, Boman index, theoretical net charge, cross-covariance, hydrophobic moment, hydrophobicity, instability, molecular weight,Tiny, Small, Aliphatic, Aromatic, Non-polar, Polar, Charged, Basic, Acidic) in different positons of each neoantigen peptide. The relationship between these peptide scores and their pathological properties might be found. The tree map shows all peptide features provideed in GNIFdb, while users can click the nodes to view their classification.
Search
The process of searching the neoantigen of interest is divided into three steps.
Disease and subtype should be selected in step one. If none specific option was selected, the search will be performed in all data by default.
 In step two, we provided five different search objects: gene name, wild type peptide, mutant type peptide, chromosome and region.
The search keyword should be input in step three, such as gene name,peptide sequence, chromosome. If users want to search a special region, users can choose region in sep two and input 17-7000000-8000000, which means the position between 7000000 and 8000000 on chromosome 17, in step three.
In step two, we provided five different search objects: gene name, wild type peptide, mutant type peptide, chromosome and region.
The search keyword should be input in step three, such as gene name,peptide sequence, chromosome. If users want to search a special region, users can choose region in sep two and input 17-7000000-8000000, which means the position between 7000000 and 8000000 on chromosome 17, in step three.
 All search modes are partial match retrieval. You can enter part or all of the information users want to search.
Search Result
The search result include basic information about gene name, chromosome, position, hla-allele, mutation, WT peptide and MT peptide, while the glioma data contains survive period. Users can use the condition selector to sort the search results or search further, and click the gene name to view the detailed information of neoantigen.

Visualization
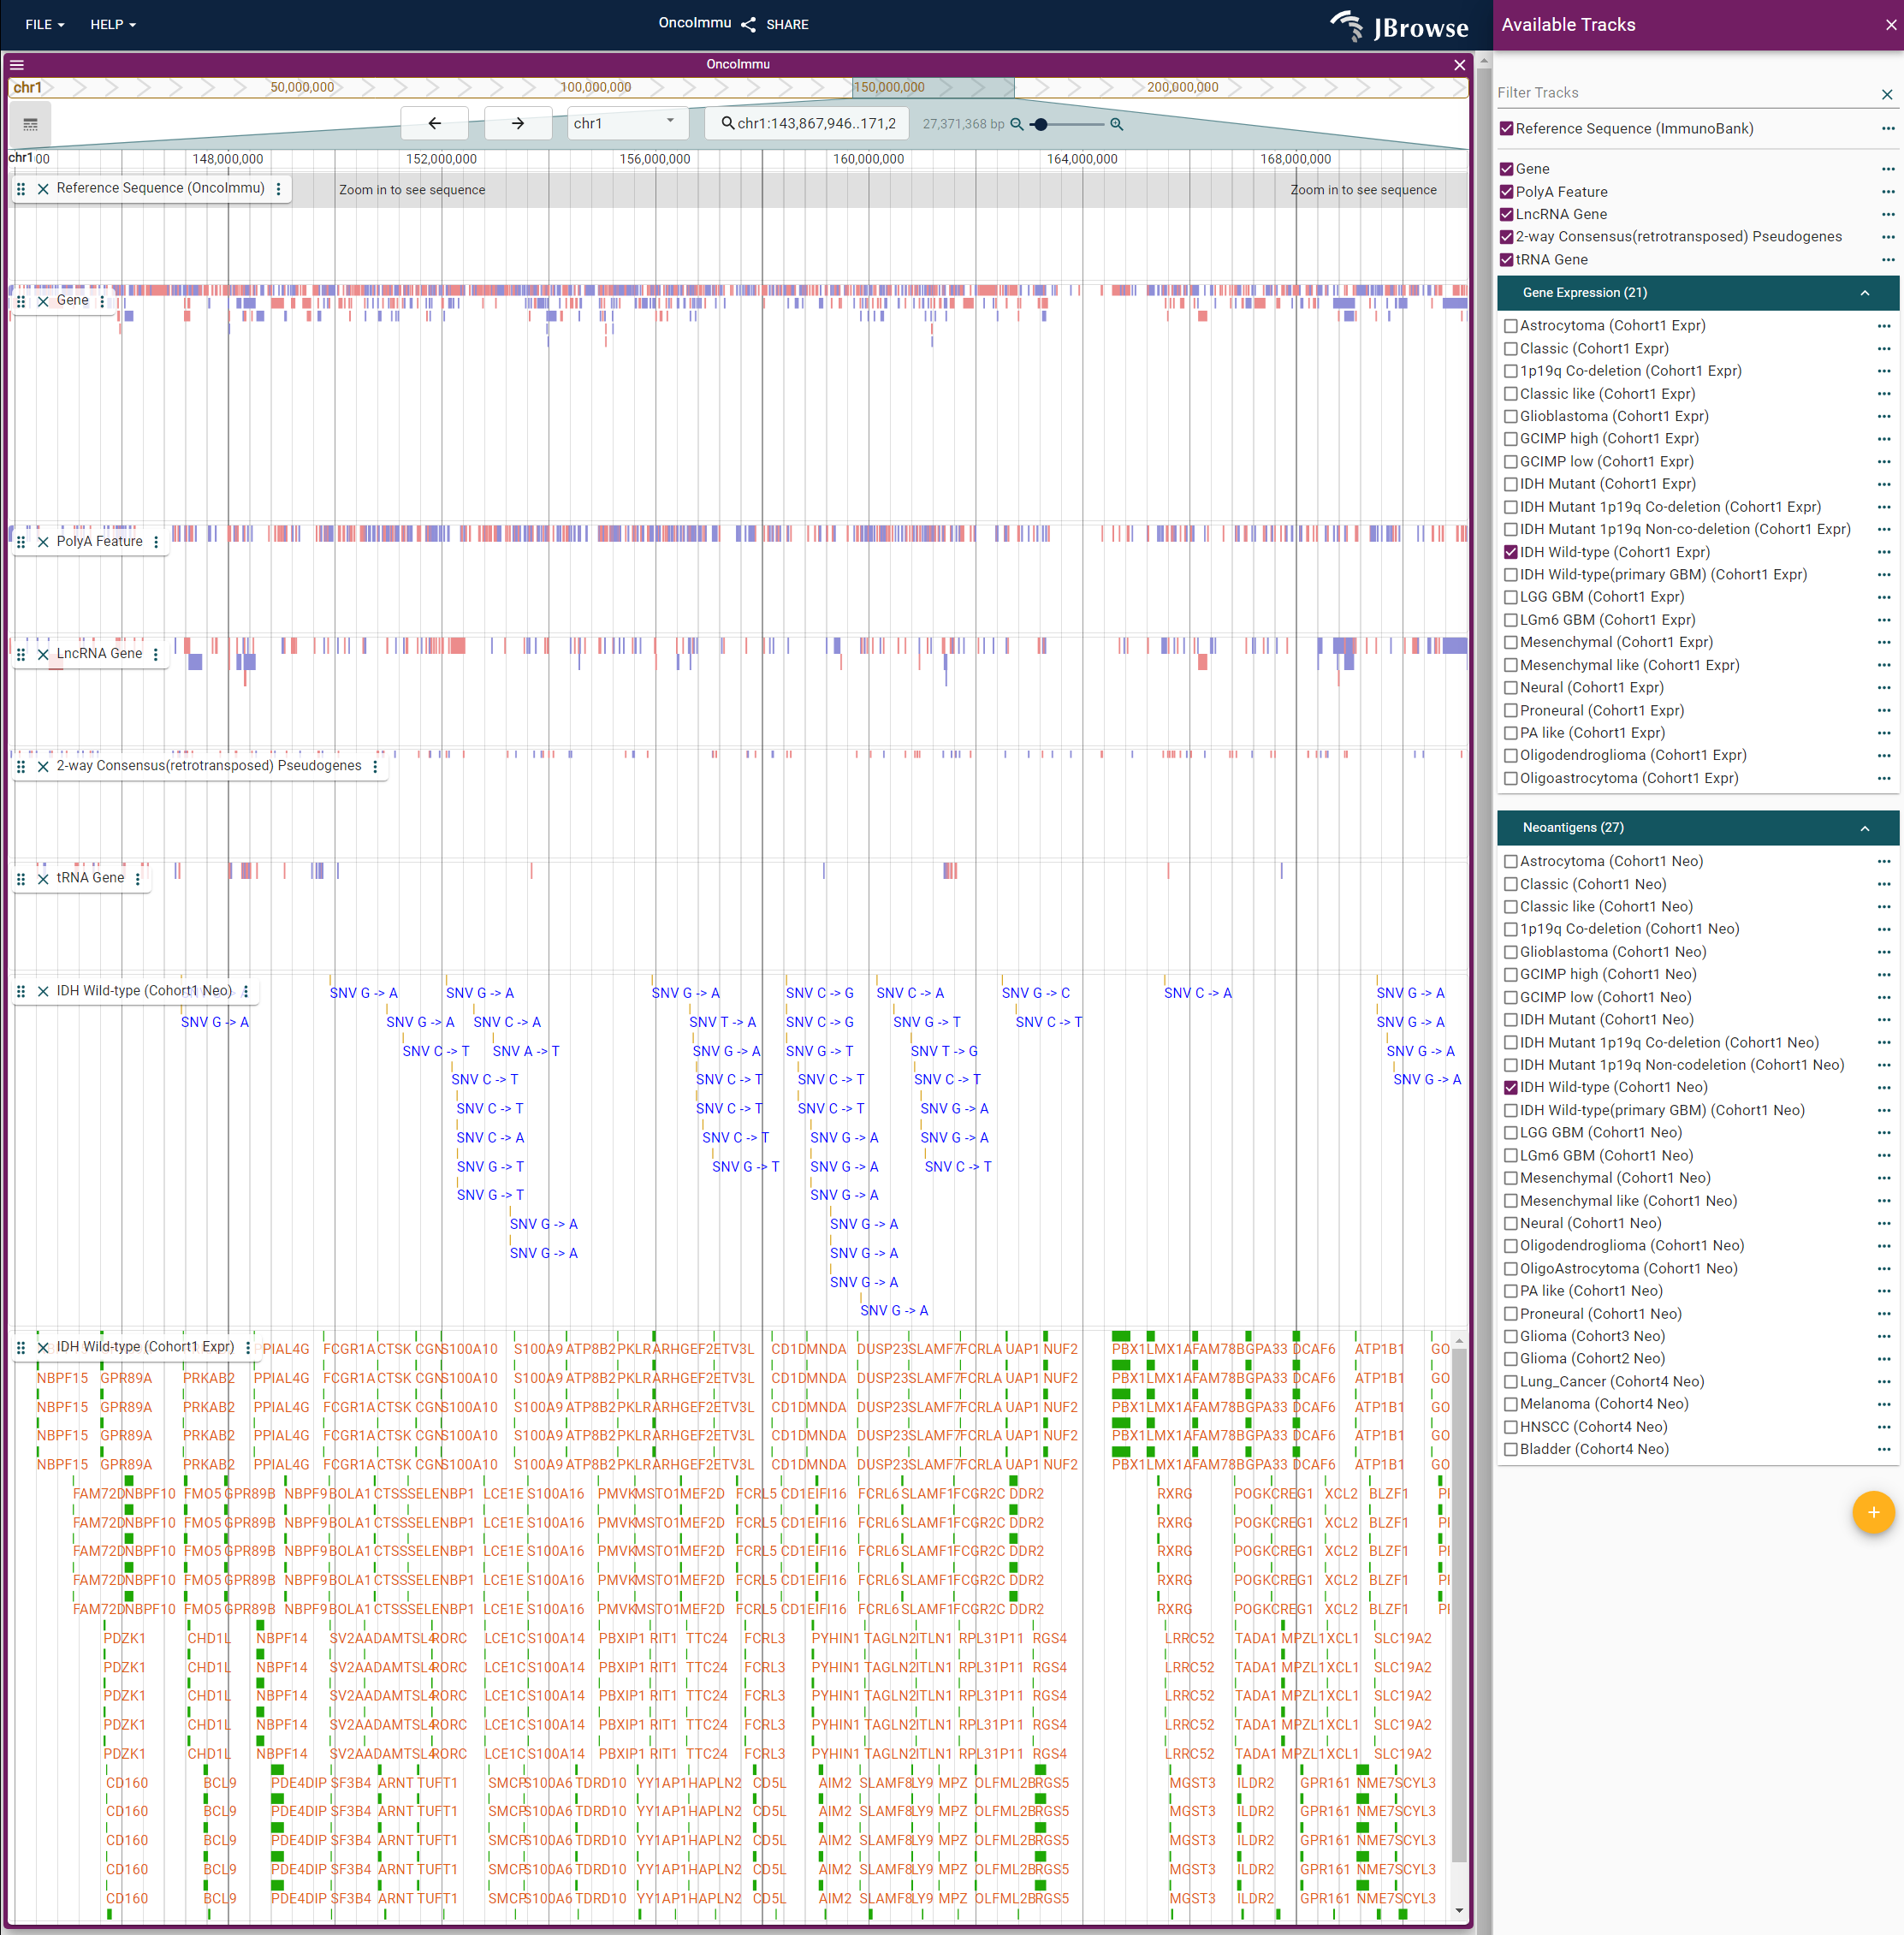
Jbrowse2 is used to visualize neoantigen information in GNIFdb. Reference sequence and five annotations from public datasets are provided. Users can select their interest diseases or subtypes, and their position and information will be showed in the window.For each gene in gene expression data, the bars from top to bottom indicate the survival period from short to long. Users can click each gene expression bar or neoantigen object to get their detail information. The window size can be zoomed by sliding the zoom bar on the top. More usage methods can refer to https://jbrowse.org/jb2/.
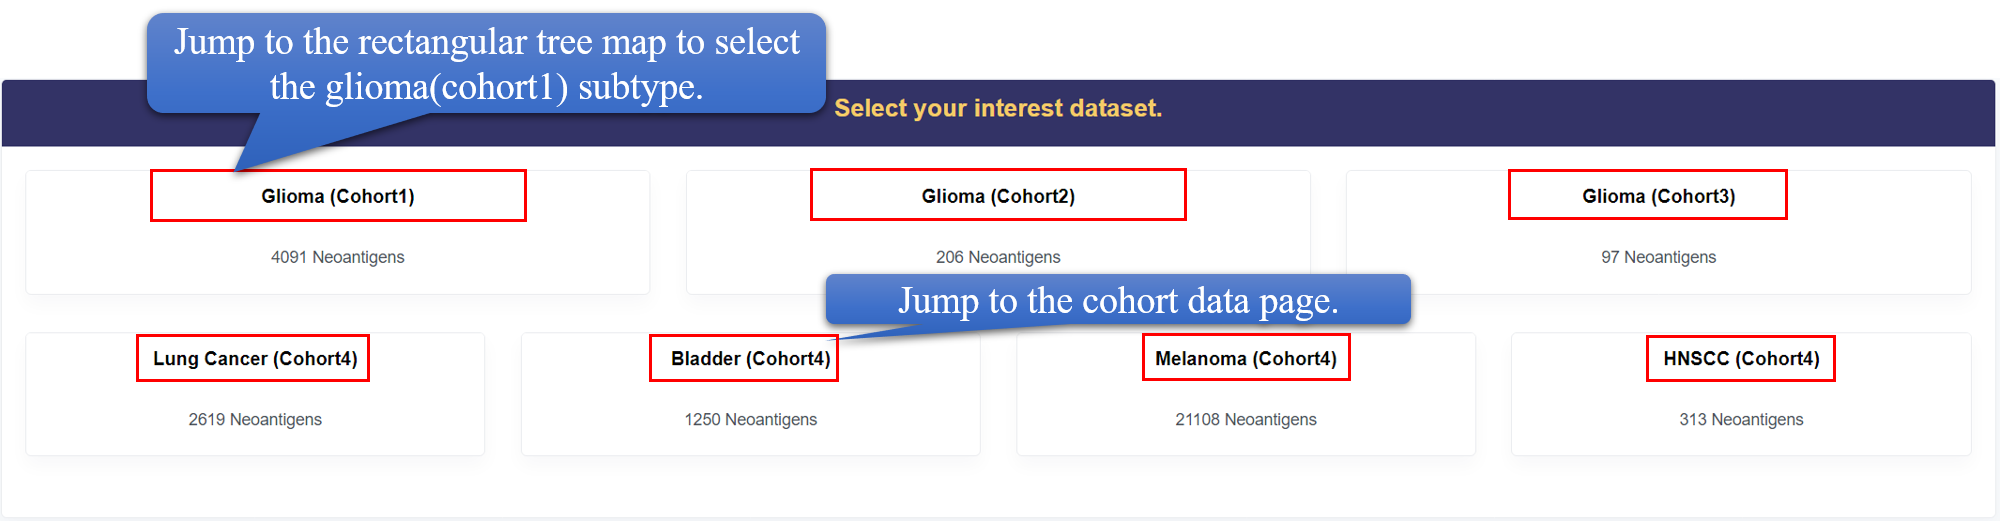
Browse
Users can browse different diseases and different datasets in this page. Specially, for glioma data form TCGA, we provide detailed classification and summary. The subtype classification is showed by the rectangular tree diagram, which can be clicked to view the subtype page. At the bottom, we provide the distribution of survival time and the enrichment of HLA in various subtypes, and the distribution boxplot of mutant type peptide score and Dai score(wild type peptide score - mutant type peptide score). In the HLA enrichment heatmap, the frequency of neoantigens decreased from upper to bottom, and the frequency of HLA allele decreased from left to right. The left top corner shows the HLAs with top binding capacity to neoantigens for glioma. The wlid type peptide score and mutant type peptide score are both calculated by netMHCpan 4.0.
In each subtype page, in addition to all the neoantigen information, we provide the relationship heatmap between neoantigens' located genes and neoantigens' binding HLAs. The frequency of genes decreased from upper to bottom, and the frequency of HLA allele decreased from left to right. The left top corner shows the HLAs with top binding capacity to neoantigens for glioma. Circos plots of gene mutation and amino acid mutation are also provided.The direction of the arrow shows mutation information.

Neoantigen
In each neoantigen's detail page, users can get the neoantigen's basic information, gene expression data and peptide features.
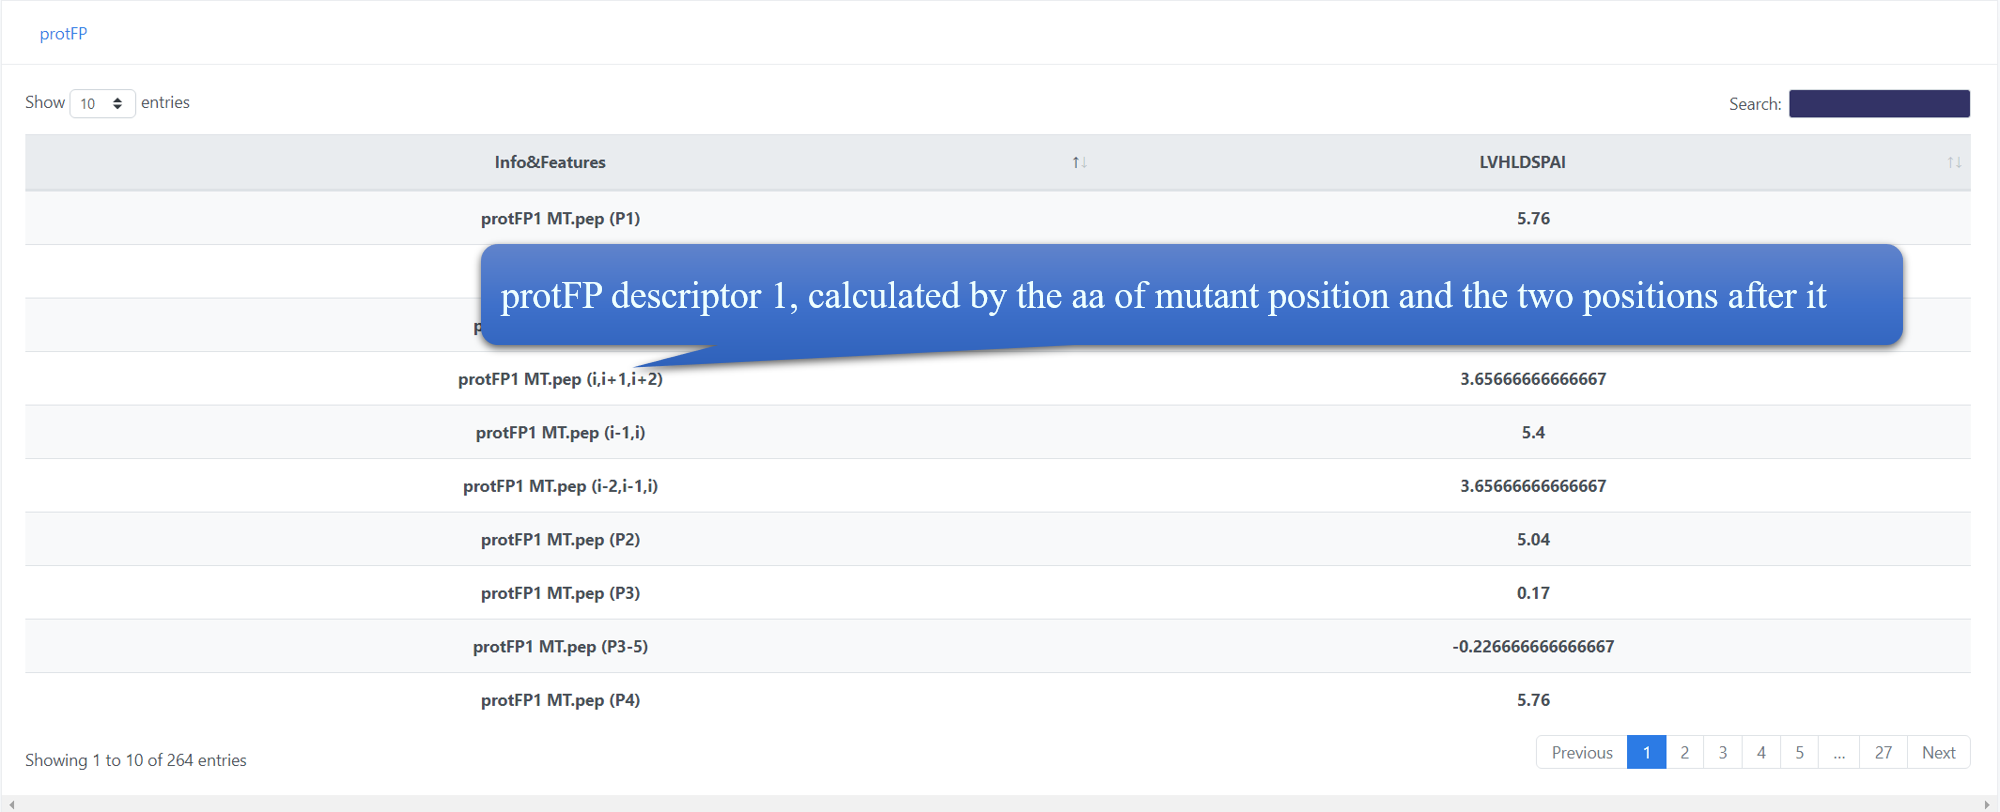
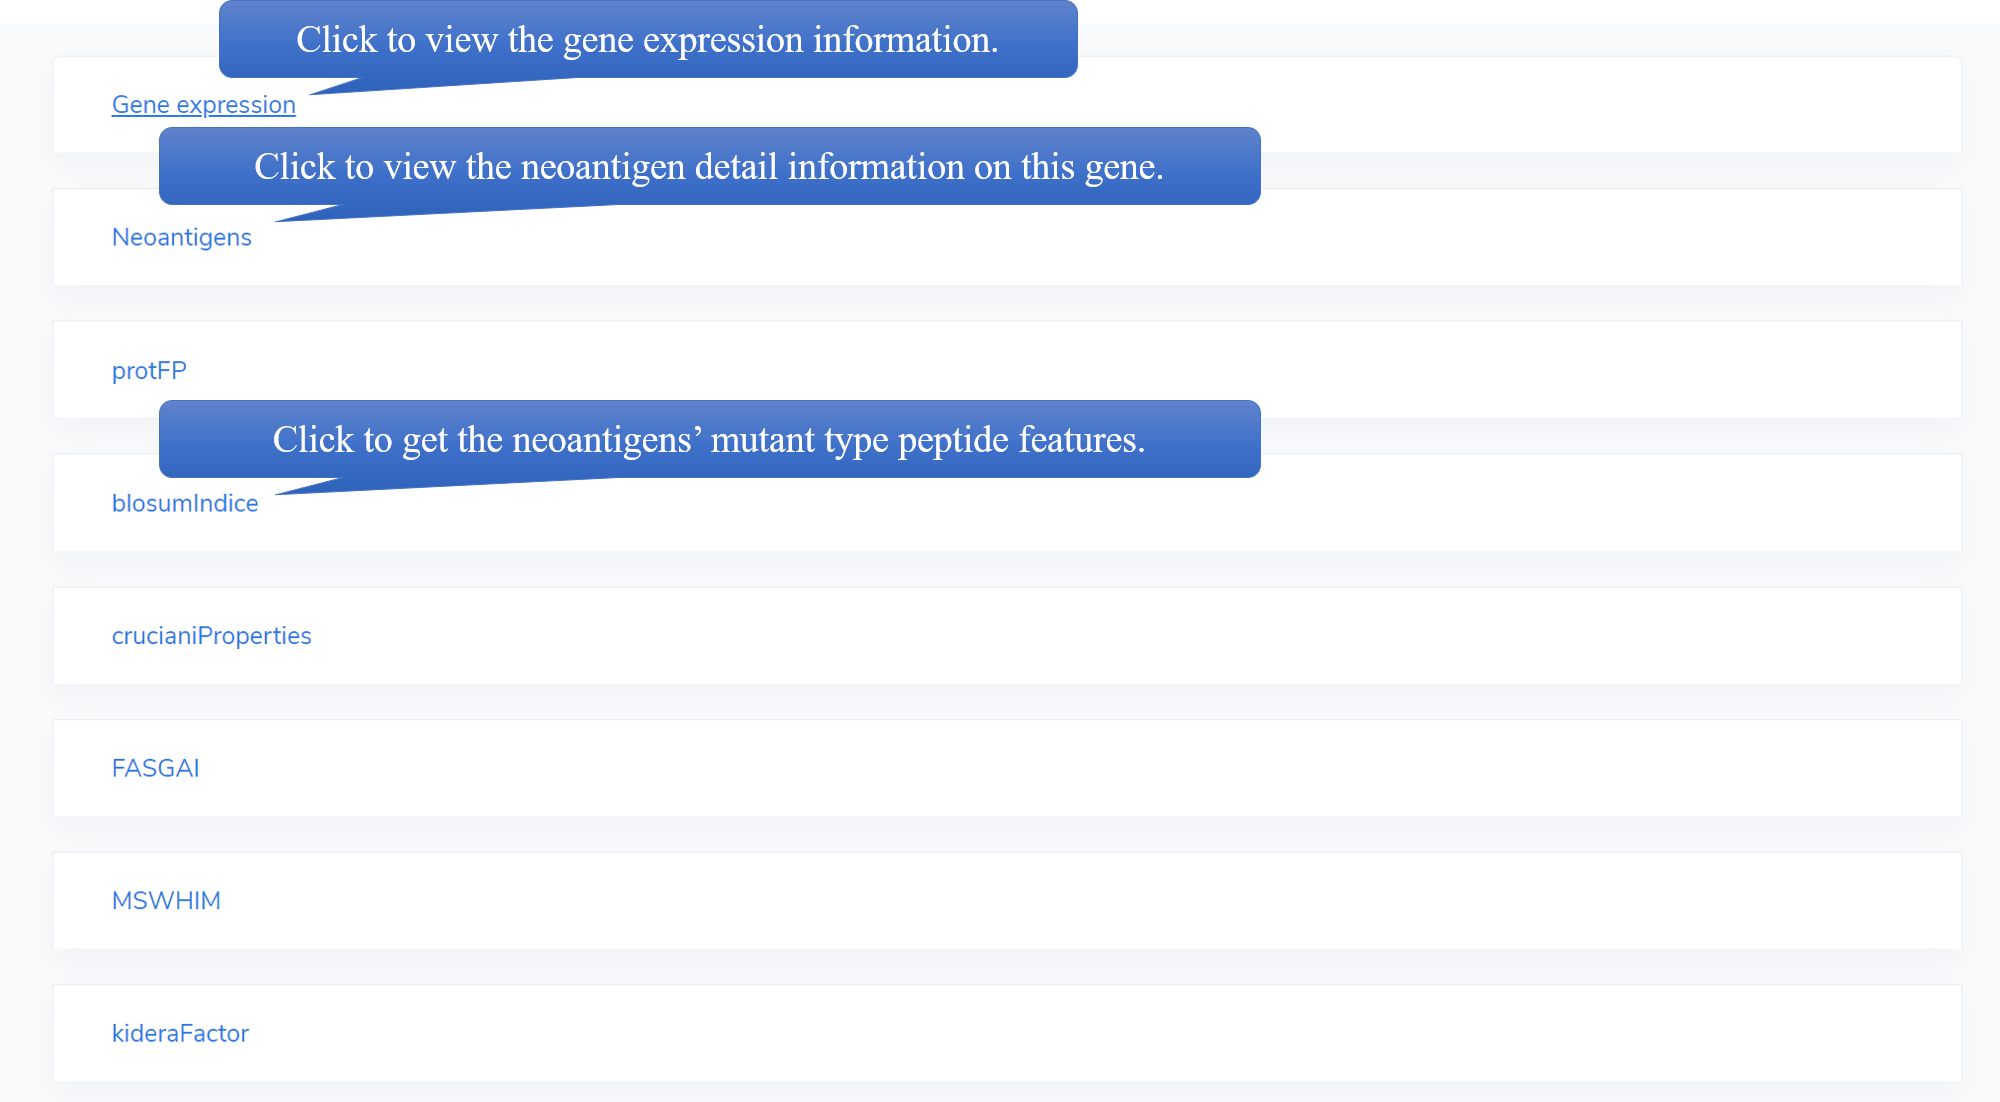 For AA discriptors(protFP, blosumIndice, cruciani Properties, FASGAI, MSWHIM, kidera Factor, stScales, T-scale, zScales, VHSE), the feature name is divided into two parts, while the first part is the feature label in the discriptor, the second part is the peptide of this score and the calculated position in brackets. For example, protFP1 MT.pep (i,i+1,i+2) means protFP descriptor 1,calculated by the aa of mutant position and the two positions after it. Generally, 'i' means the mutant position.