Introduction to T Cell & SCRNAseq
T Cell
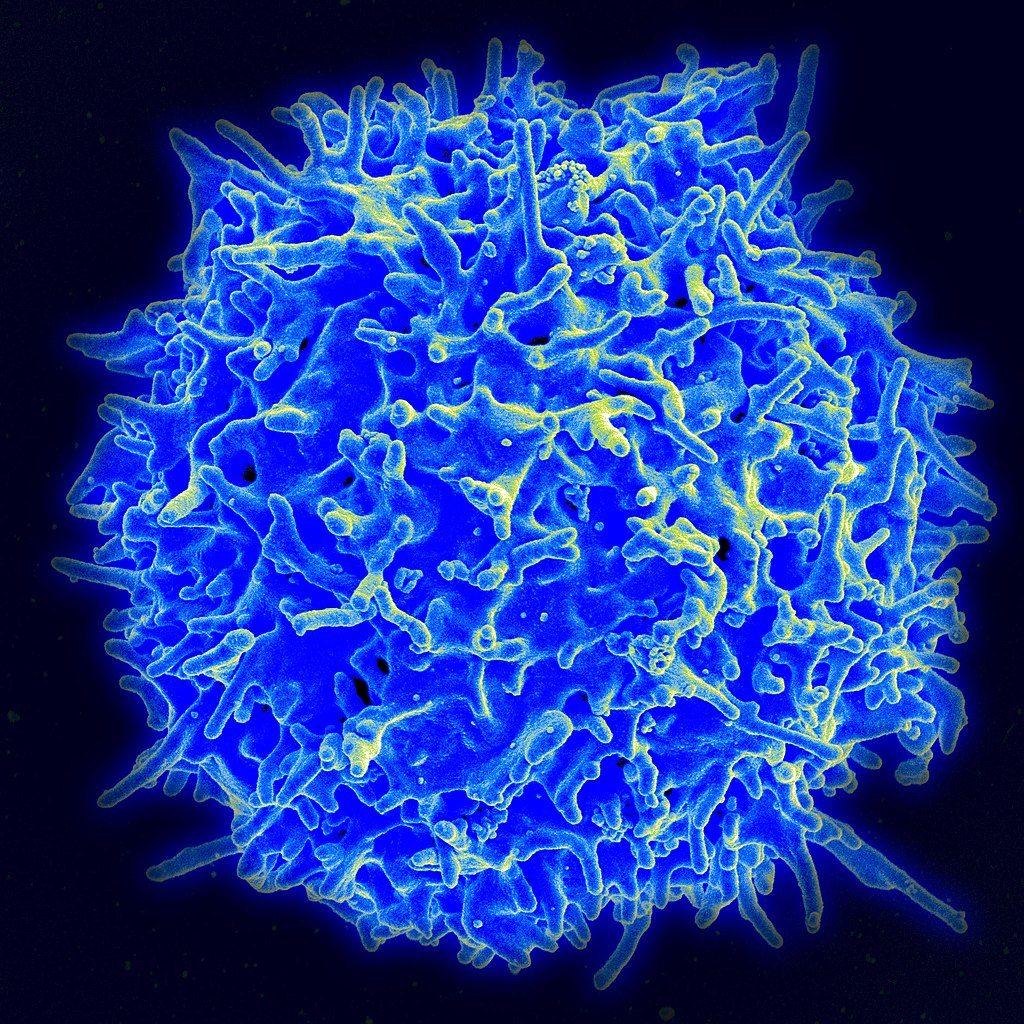
T cells are born from hematopoietic stem cells, found in the bone marrow. Developing T cells then migrate to the thymus gland to develop (or mature). T cells derive their name from the thymus.After migration to the thymus, the precursor cells mature into several distinct types of T cells. T cell differentiation also continues after they have left the thymus. Groups of specific, differentiated T cell subtypes have a variety of important functions in controlling and shaping the immune response.
One of these functions is immune-mediated cell death, and it is carried out by two major subtypes: CD8+ "killer" and CD4+ "helper" T cells.
(These are named for the presence of the cell surface proteins CD8 or CD4.) CD8+ T cells, also known as "killer T cells", are cytotoxic – this means that they are able to directly kill virus-infected cells, as well as cancer cells.
CD8+ T cells are also able to use small signaling proteins, known as cytokines, to recruit other types of cells when mounting an immune response. A different population of T cells, the CD4+ T cells, function as "helper cells".
Unlike CD8+ killer T cells, the CD4+ helper T (TH) cells function by further activating memory B cells and cytotoxic T cells, which leads to a larger immune response.
The specific adaptive immune response regulated by the TH cell depends on its subtype, which is distinguished by the types of cytokines they secrete.
SCRNAseq
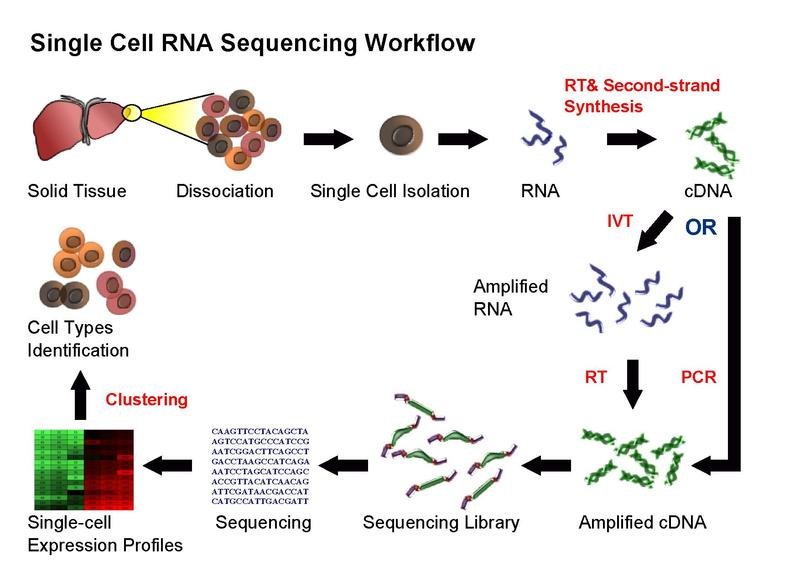
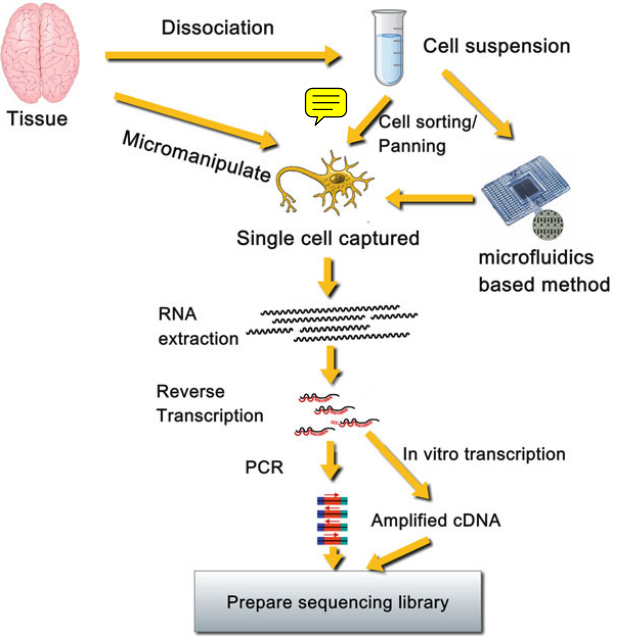 The Single-cell RNA sequencing (scRNA-Seq) is a method to extract, amplify and sequence genome or transcriptome
at the level of single cell.
Single cells are isolated from a sample into either wells or droplets, cDNA libraries are generated and amplified, libraries are sequenced,
and expression matrices are generated for downstream analyses like cell type identification.
The Single-cell RNA sequencing (scRNA-Seq) is a method to extract, amplify and sequence genome or transcriptome
at the level of single cell.
Single cells are isolated from a sample into either wells or droplets, cDNA libraries are generated and amplified, libraries are sequenced,
and expression matrices are generated for downstream analyses like cell type identification.
Method
Database
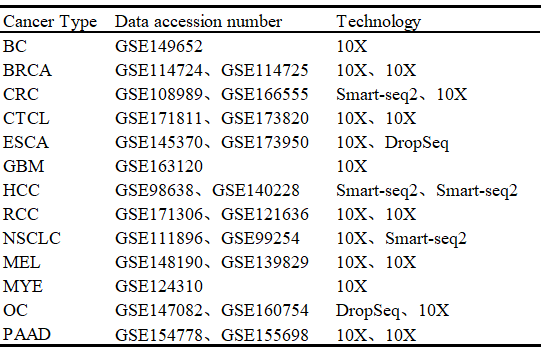
After preliminary filtering, we collected single cell sequencing data of 14 common human cancer types from the GEO database,
and expanded most of the cancer data. In consideration of data quality and batch effects, we adopted personalized standards to formulate quality control
indicators and used the Harmony algorithm to integrate different datasets. Finally, we annotated T cells through a combination of manual and automatic
methods, laying a foundation for subsequent T cell subtype identification and bioinformatics analysis.
T Cells
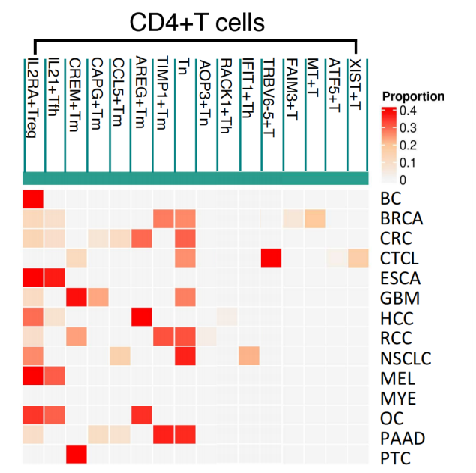 Based on the T cell data from all cancers, we annotated T cell subsets in combination with the characteristic genes disclosed in most studies,
then checked the enrichment status of these subsets through gene set enrichment analysis. Using a logistic regression model trained with elastic network regularization,
we predicted the similarity among T cell subsets of different tumor types. The model's stability was confirmed through cross-validation. Finally, we identified a total of 16 CD4+T
subpopulations in 14 common cancer types, revealing their distribution across these cancers.
Based on the T cell data from all cancers, we annotated T cell subsets in combination with the characteristic genes disclosed in most studies,
then checked the enrichment status of these subsets through gene set enrichment analysis. Using a logistic regression model trained with elastic network regularization,
we predicted the similarity among T cell subsets of different tumor types. The model's stability was confirmed through cross-validation. Finally, we identified a total of 16 CD4+T
subpopulations in 14 common cancer types, revealing their distribution across these cancers.
Bioinformatics Analysis
To analyze the T cells across different cancer types, we utilized various bioinformatics methods such as enrichment analysis, tissue-specific analysis, cell communication analysis, and pseudo-time analysis. These methods helped in detailed description of the distribution and unique characteristics of T cell subsets among various cancers. We identified a subpopulation of exhausted cells characterized by high expression of the STMN1 gene and deduced an exhaustion pathway from naive T cells (Tn) to exhausted T cells (Tex), providing valuable insights and a systems perspective for understanding the immune landscape in cancer.