Help
Hello,welcome to GTABdb.The GTABdb focuses on the effects of TCR and BCR on glioma patients.GTABdb contains clinical information and immune database of 932 glioma patients, and shows the relationship between immune protein and clinical characteristics of glioma patients in different aspects.Next, I will introduce the content and usage of this website.
OS
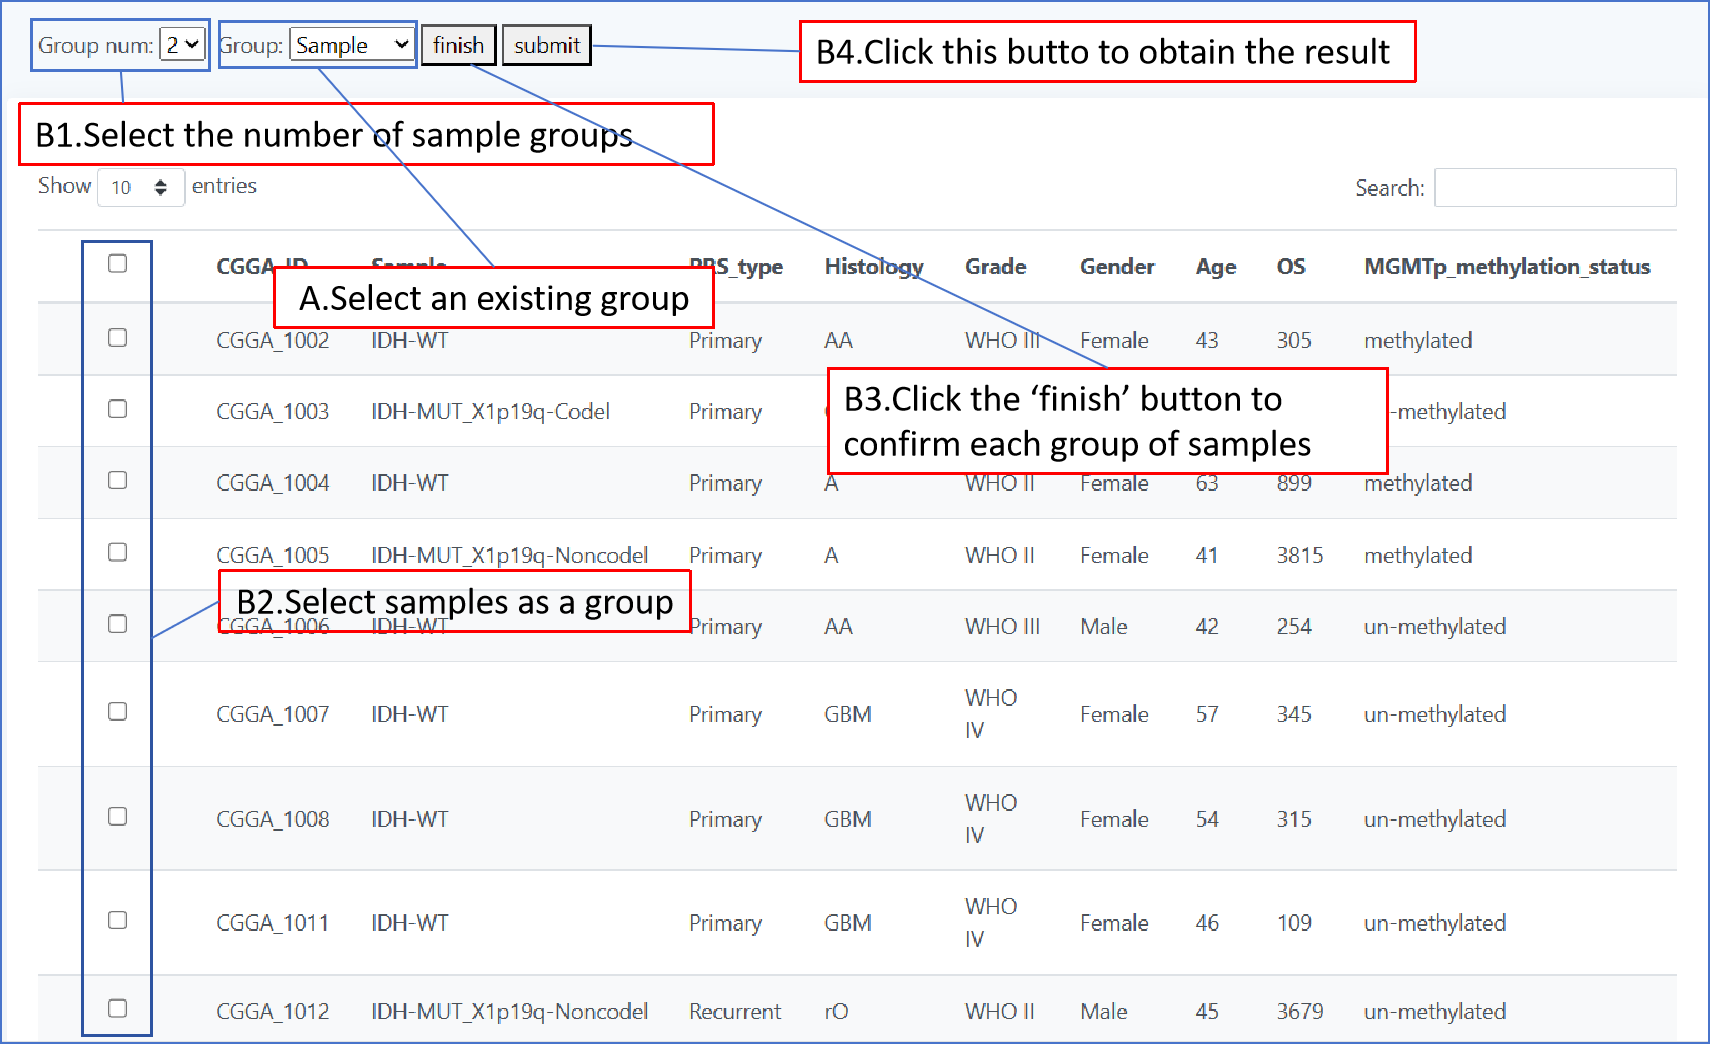
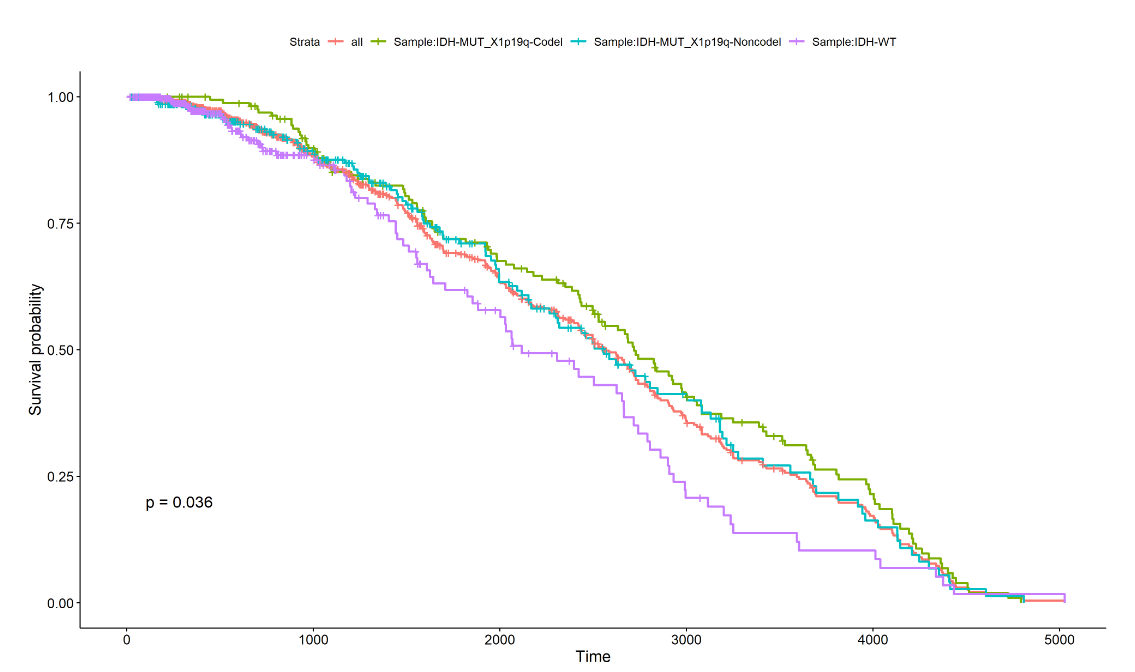
In page " OS ", we used the way of plotting survival curves to present the prognosis of different patients. We have provided two methods of drawing, one using pre specified groupings to draw the graph and the other self selecting patient groupings to draw the graph. When you use the first method, select the grouping type by a drop-down form 'Group',then click "plot" to get the result; When you use the second method, first select the number of groups you want by the form "group num", then click on the check box in the table to select patients, and you will need to click the "finish" whenever you have selected a group of patients.When you have selected all groups, click "submit" to get the result.
Data
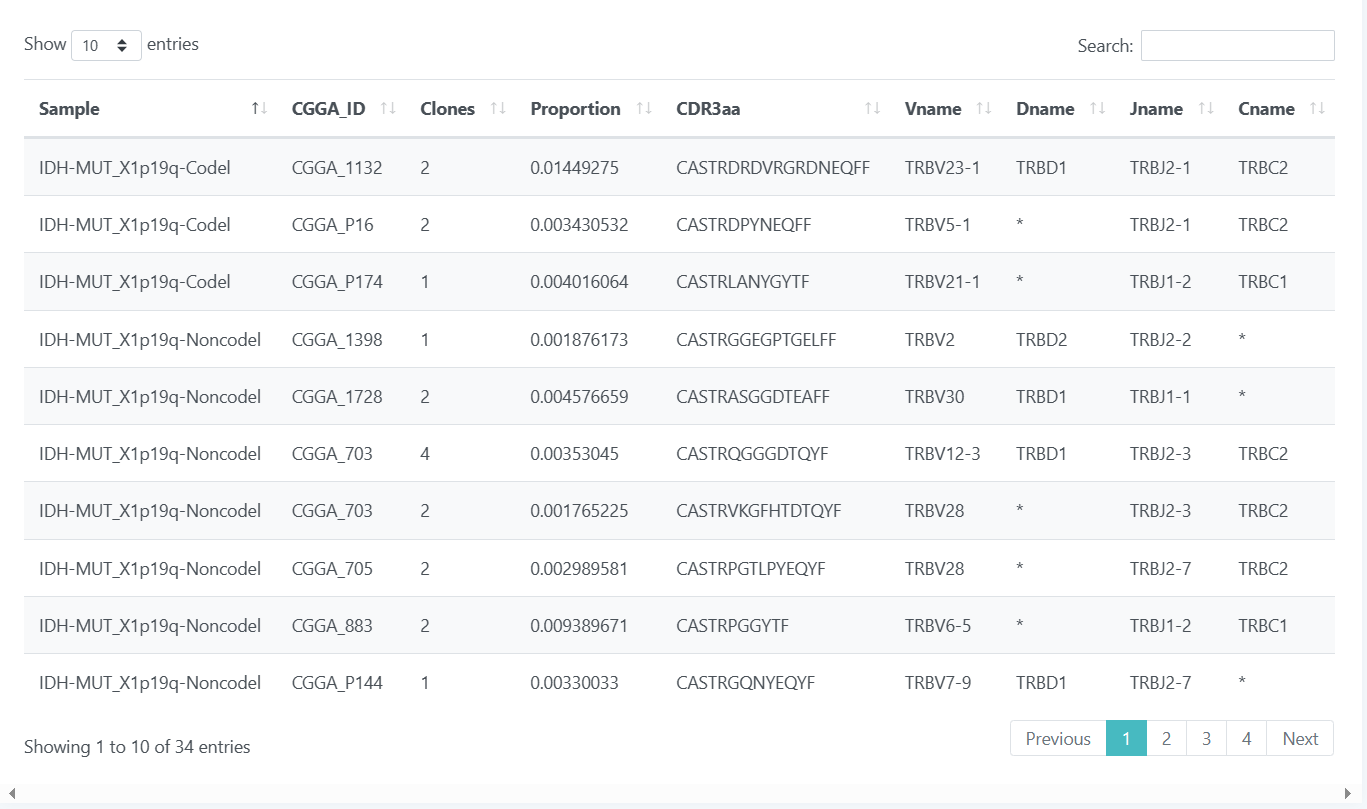
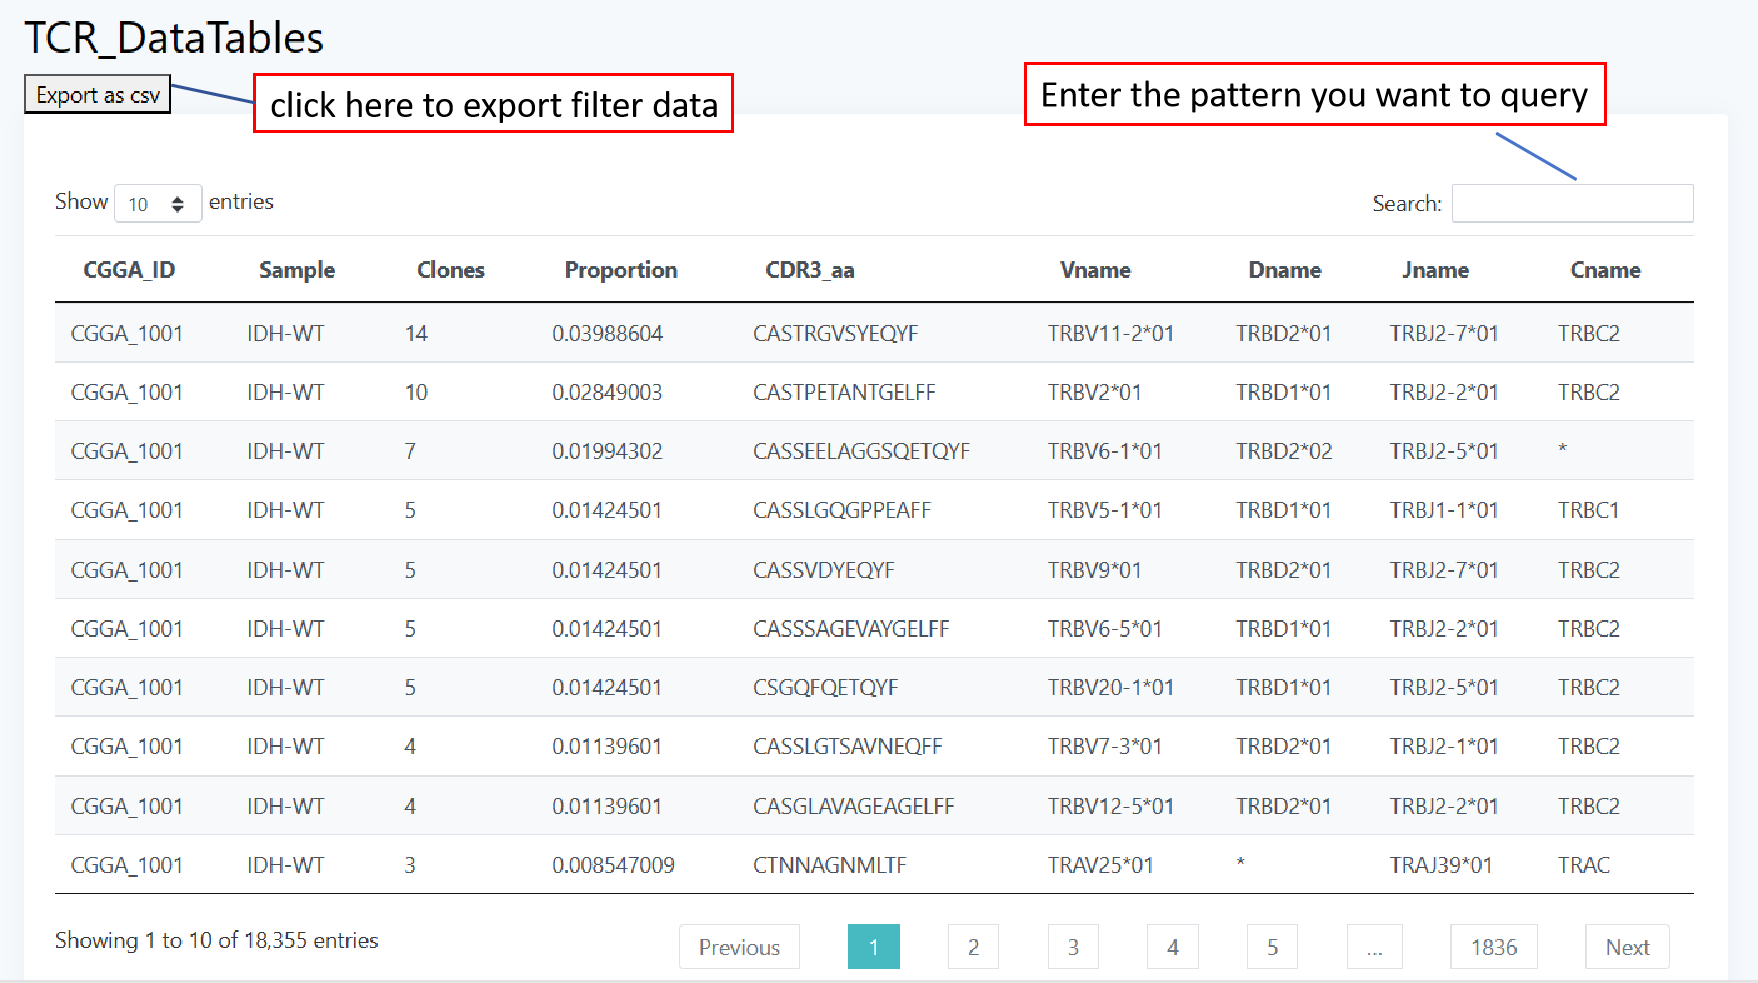
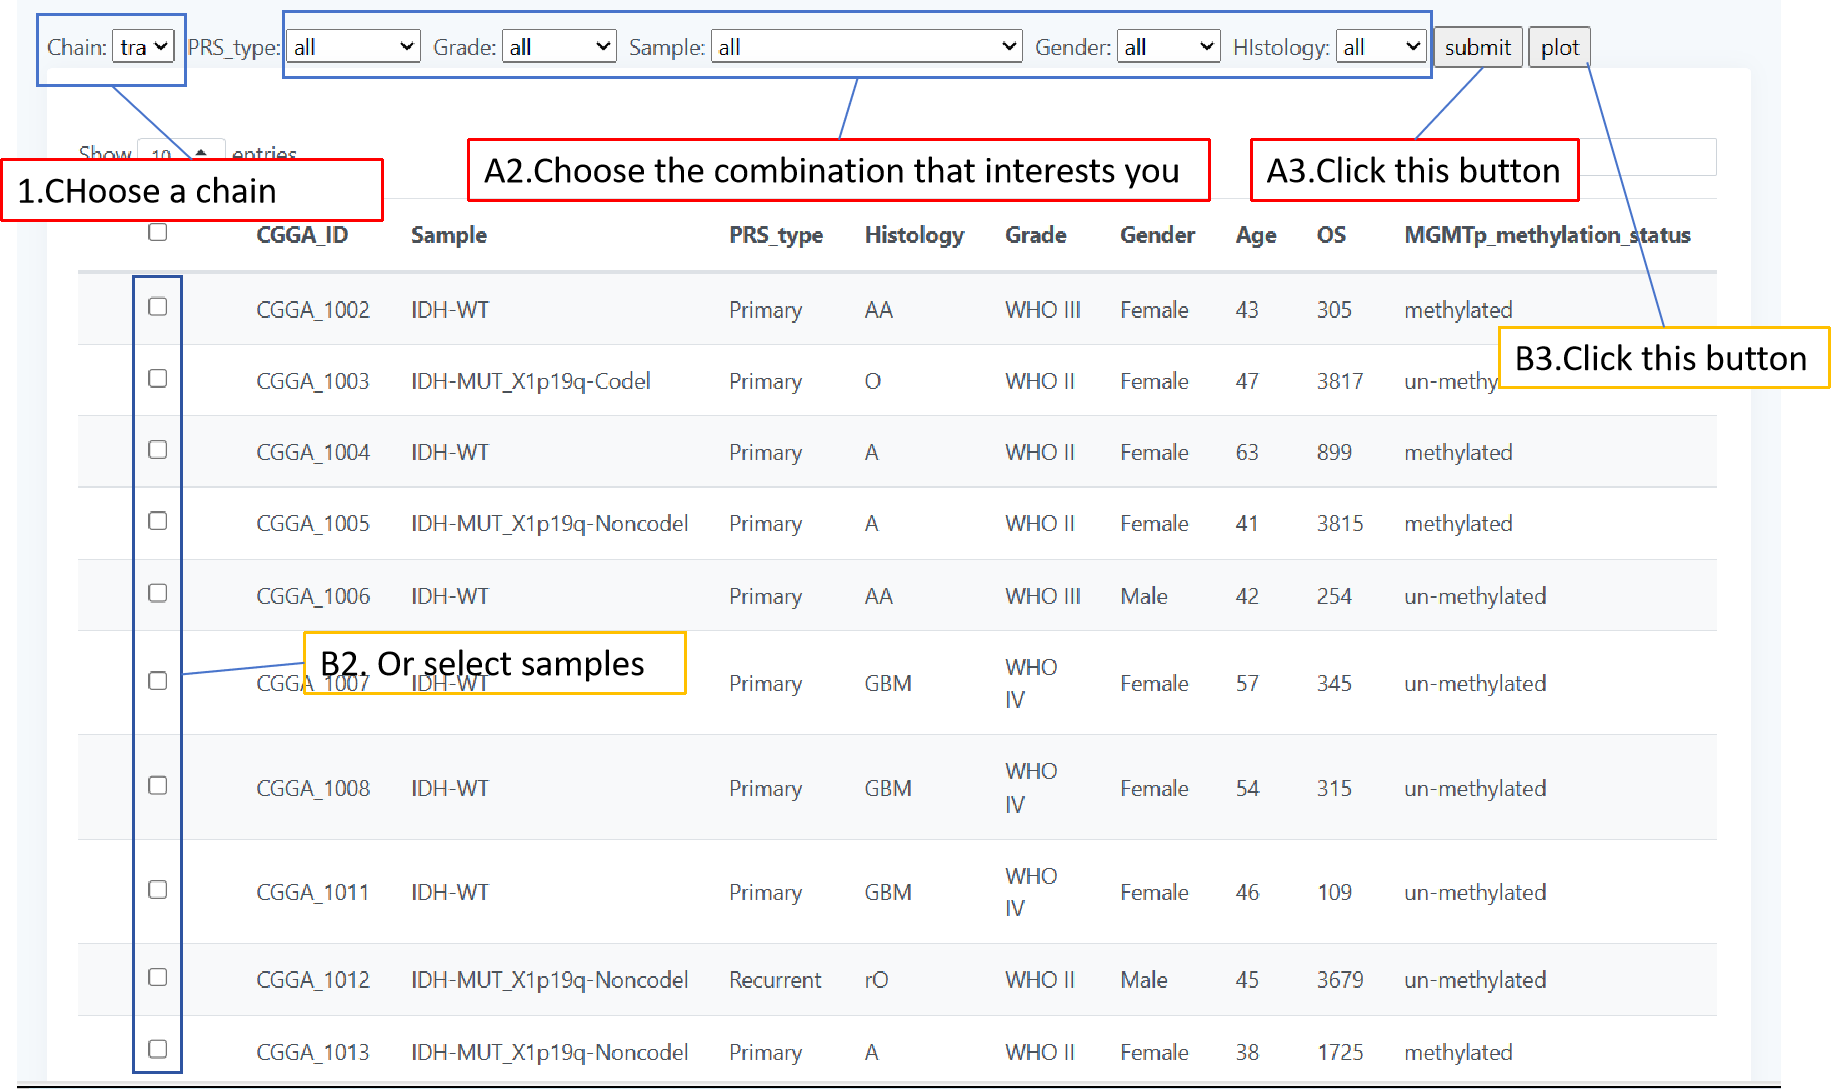
The data page includes three parts of data: TCR, BCR, and clinical information, which are presented in an interactive tabular fashion. You are free to select the number of bars displayed per page of the table and can also search for your data of interest through the search box in the top right corner. If you want to learn more about these data, please click TCR, BCR, Clinical information.
CDR3 Length
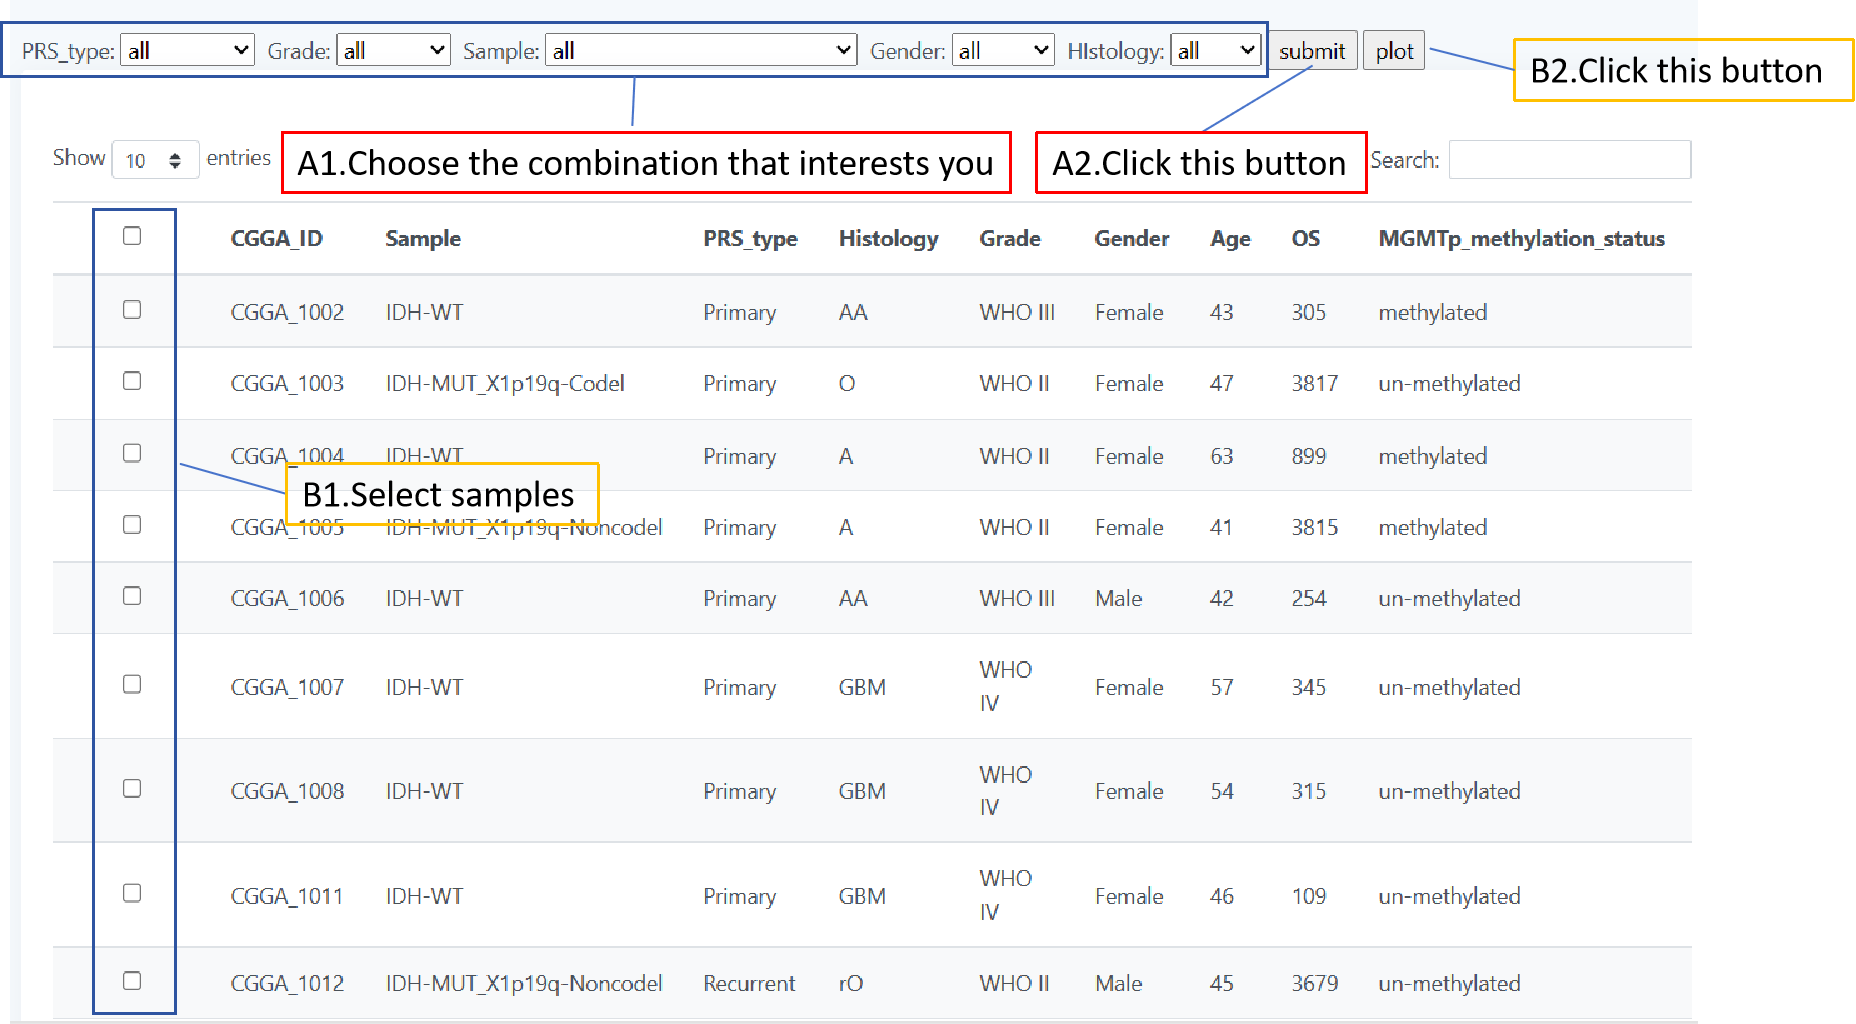
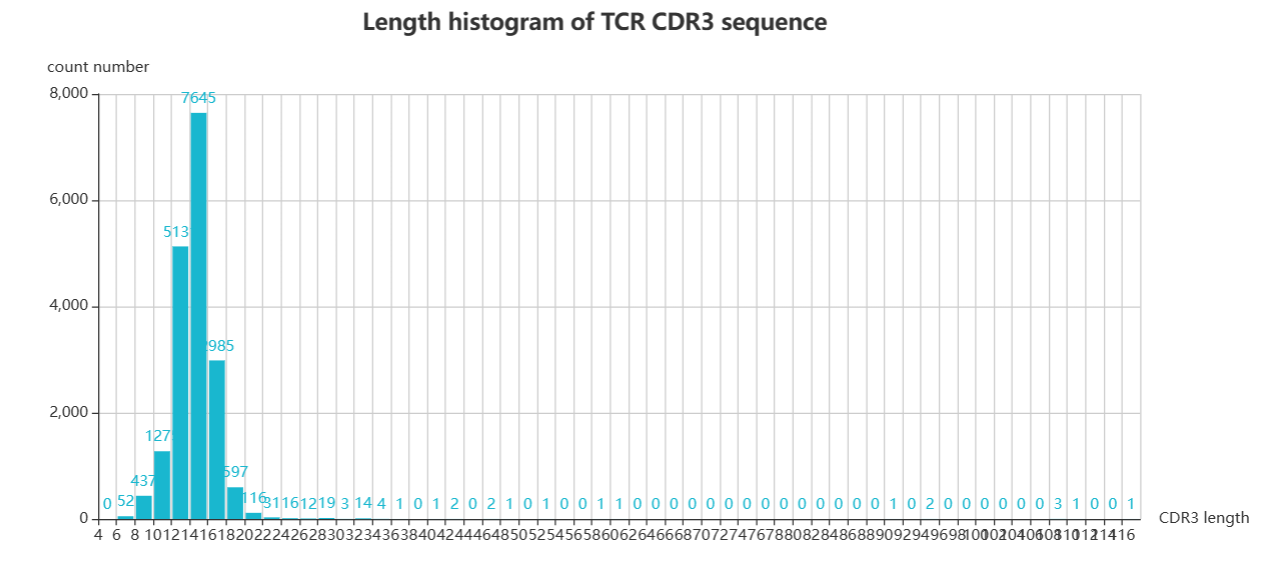
The length page focuses on CDR3 sequence length variations exhibiting TCR and BCR of different glioma patients. You can screen patients by a combination of different classes of glioma patients to get a distribution map of the lengths of their CDR3 sequences. You can also select the patients you would like to observe by means of checkboxes in the table. When you choose the first method, select your desired combination by five forms above the table and click 'plot' for the result;When you use the second method, click the checkbox in the table to select the patient of interest and click 'submit' to get the result.
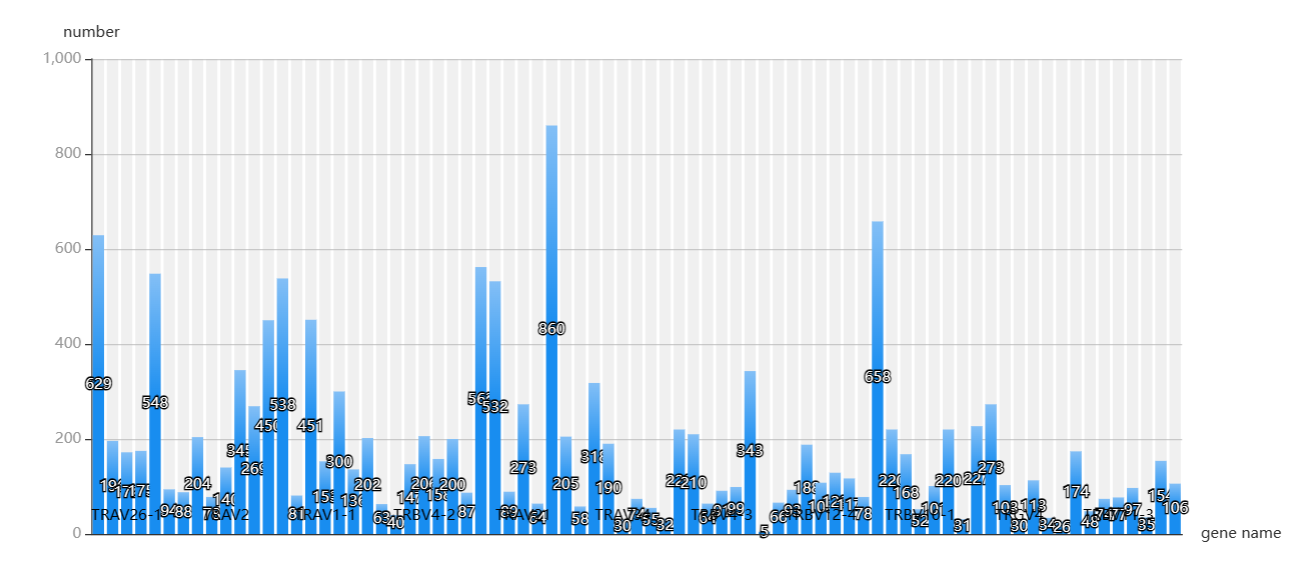
Gene
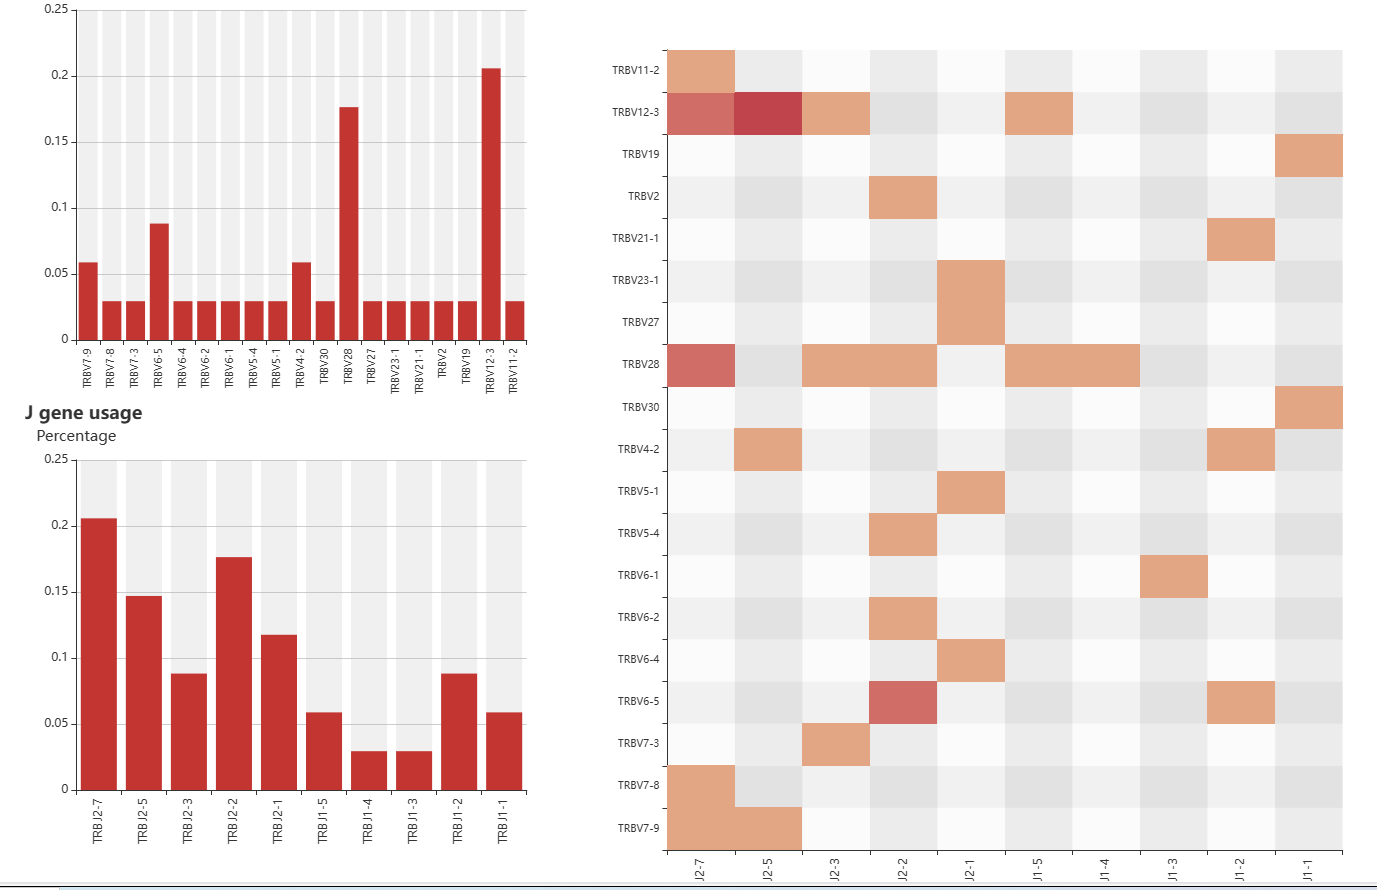
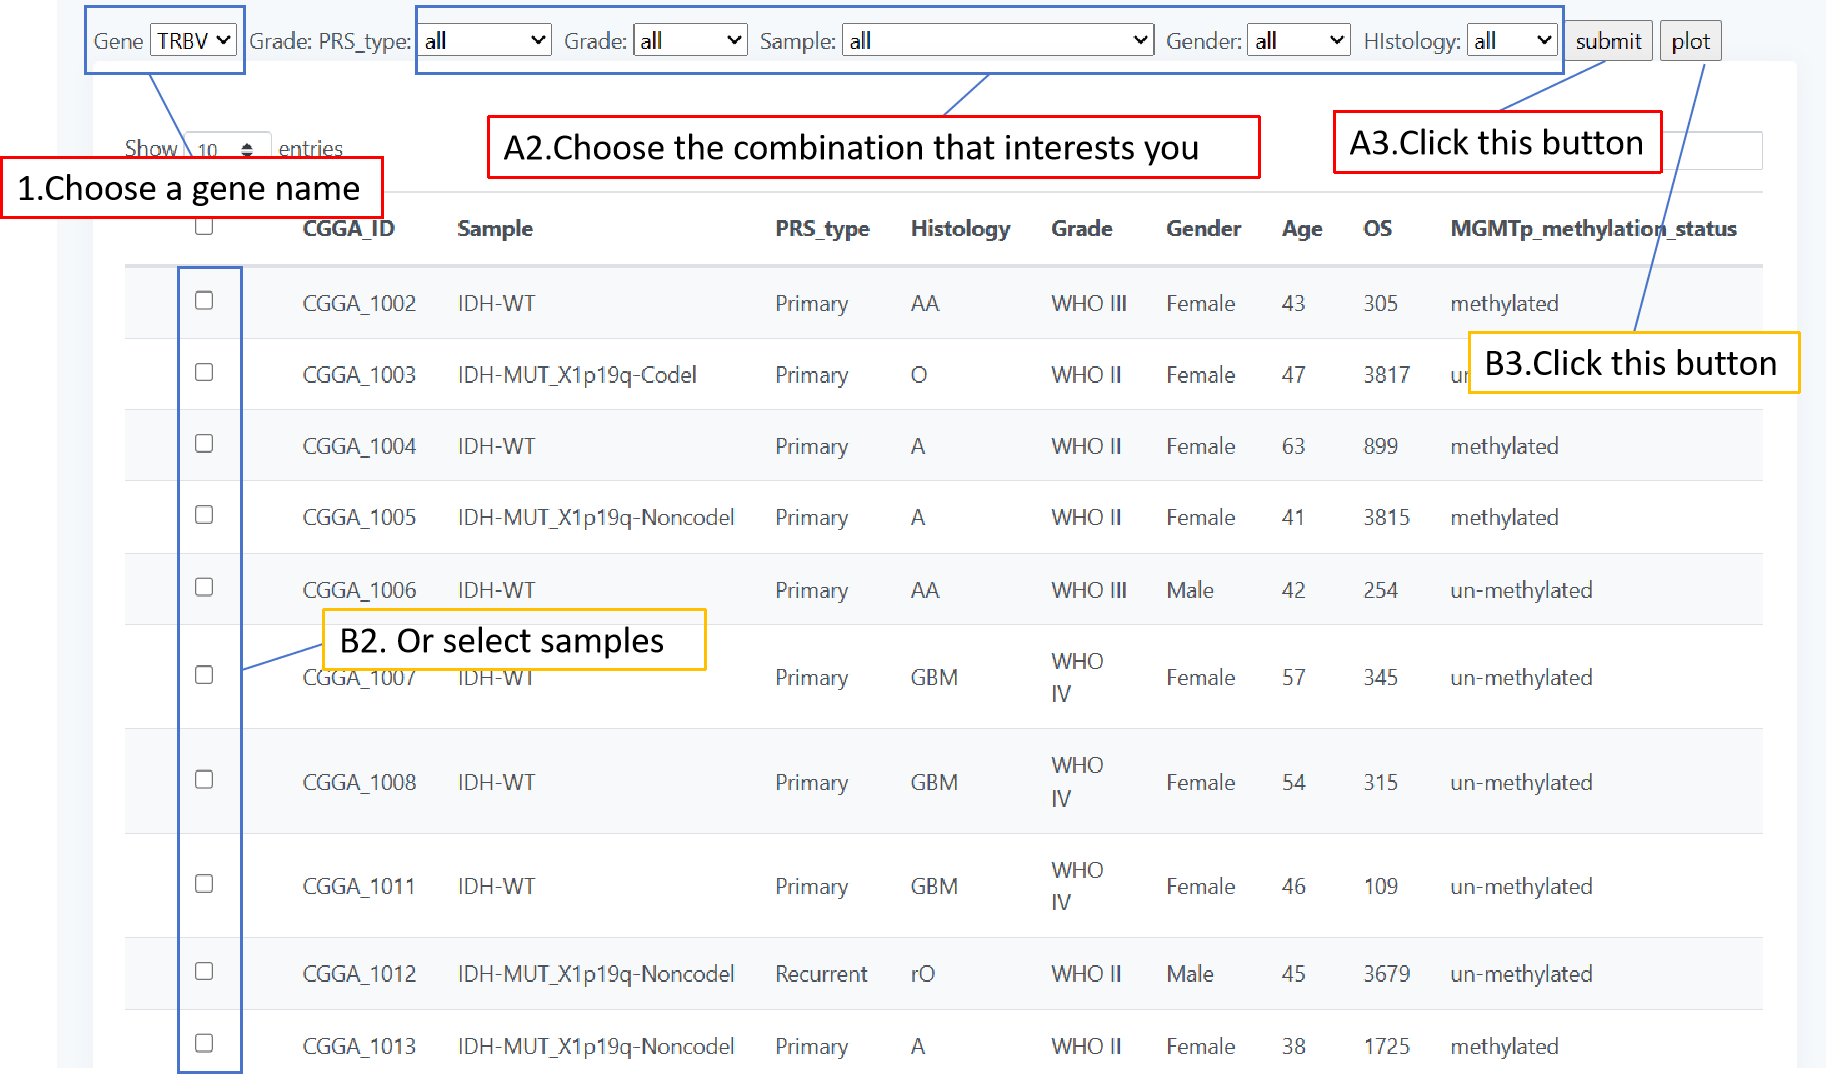
The frequency of genes encoding CDR3 sequences is displayed on the page "Gene". When you want to know how often different genes are expressed in these patients, first select a family of genes by the form 'gene' and then you can screen your interested patients by the form above the table and click 'plot' to get the result. You can also select your patient of interest by a check box in the table and click 'submit' when selected gives the result.
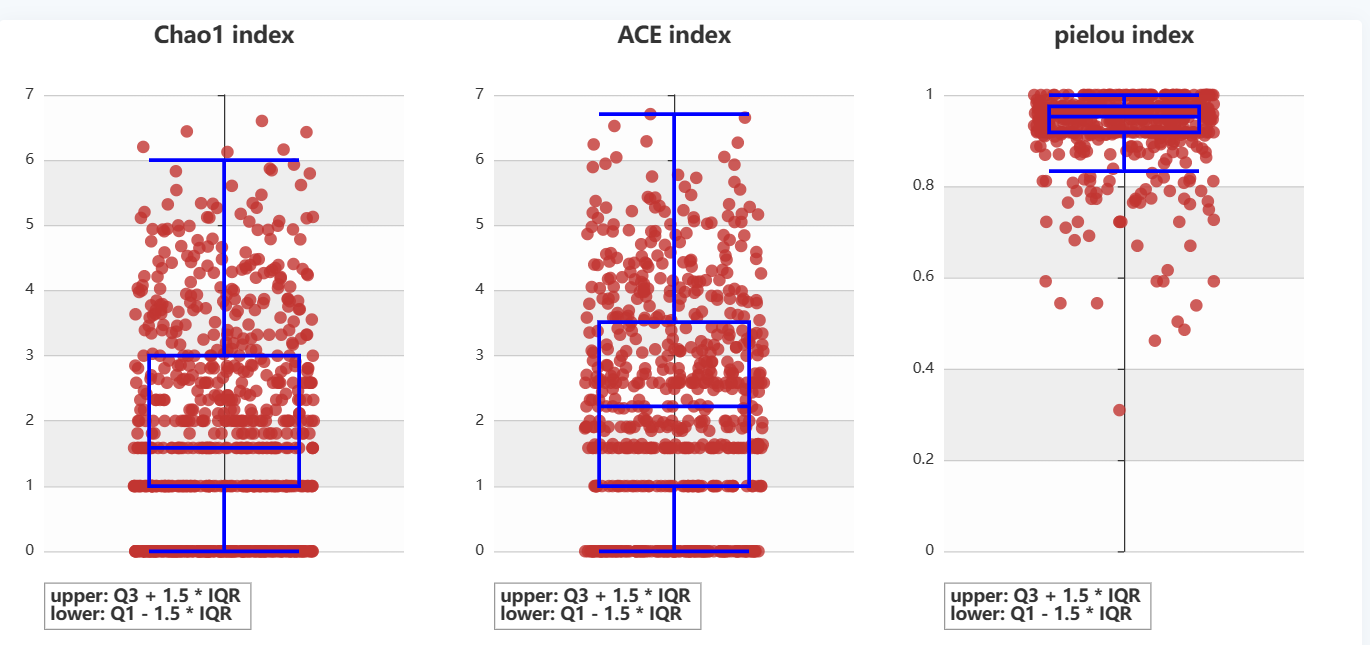
Diversity & Complexity
Page 'Diversity & Complexity' demonstrates the diversity of immune information in glioma patients, including four indices Chao1, clonality, Shannon, Pielou. You can screen your patient population of interest by combining forms above the table, you can also select your patient population of interest by checkboxes in the table. When you use the former method click on 'plot' to get the result and when you use the latter method click on 'submit' to get the result.
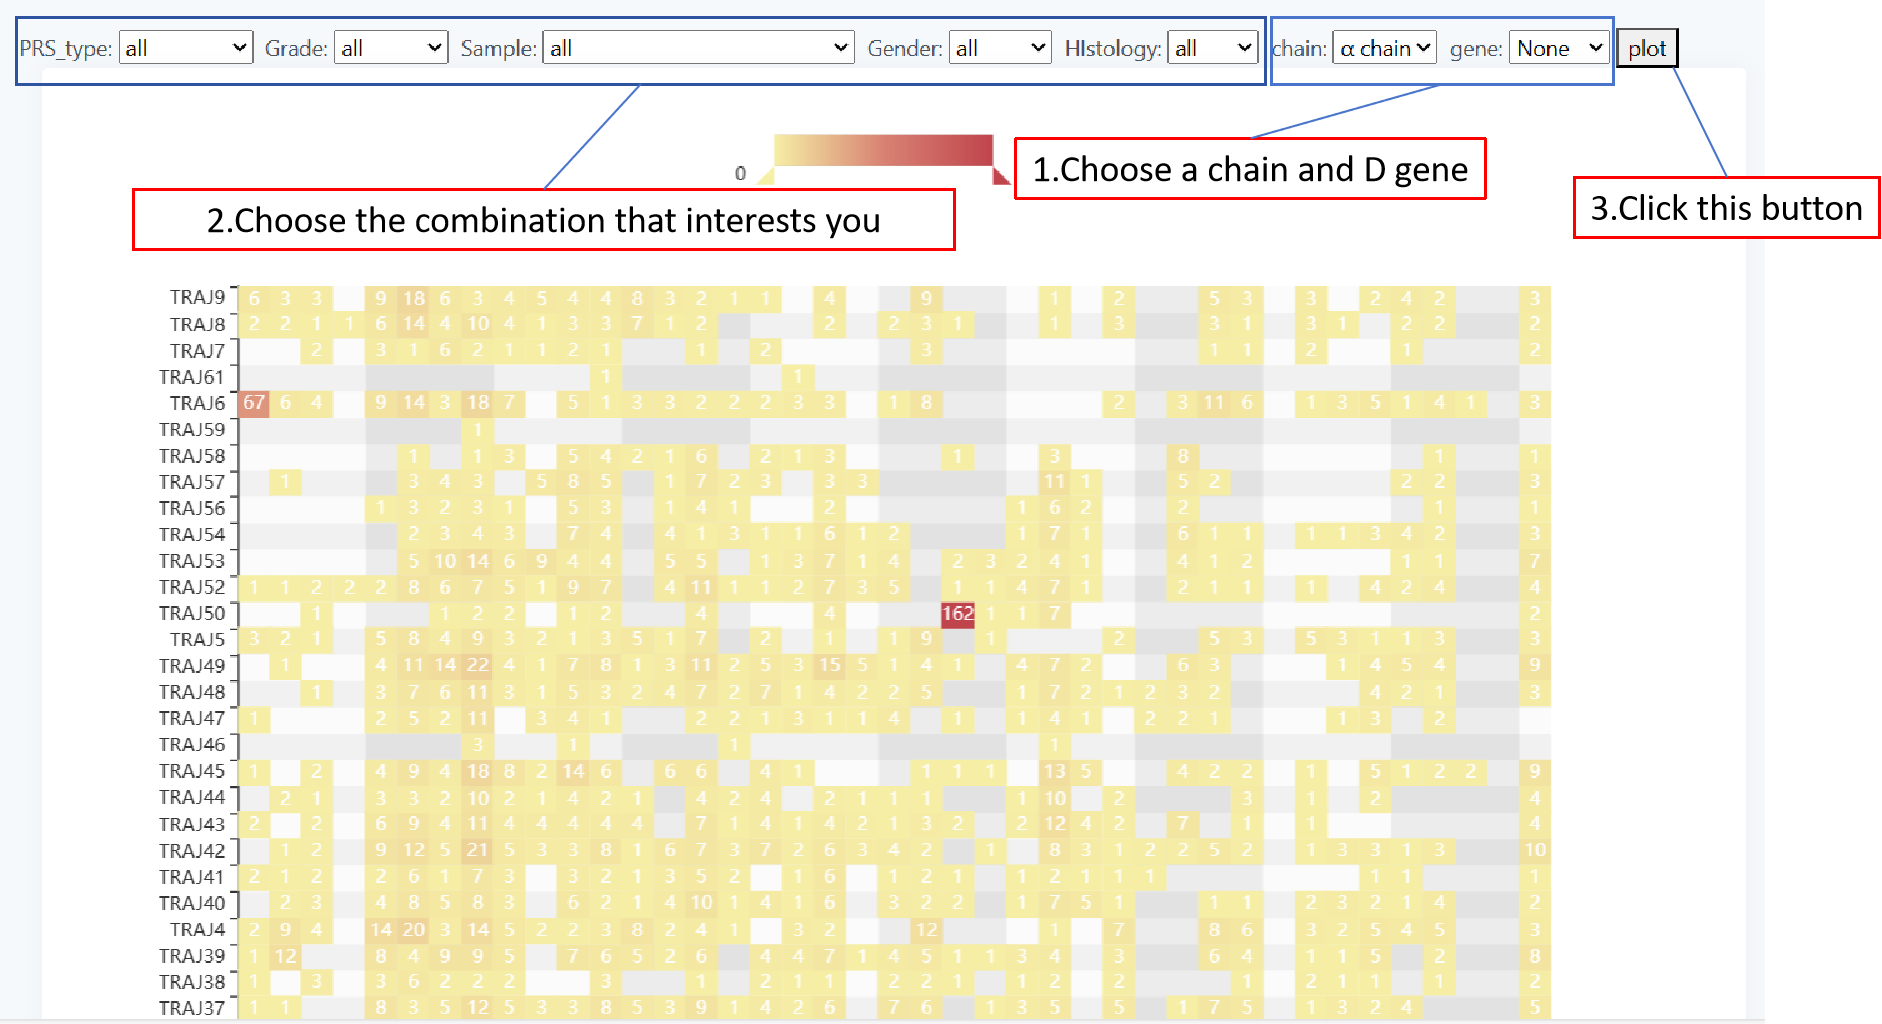
Rearrangement
The page 'Rearrangement' presents the frequency of V (D) J gene rearrangements and visualizes the results by way of a Heatmap. You can select the patient group for your susceptibility panel via five forms, 'PRS_type','Grade','Sample','Gender','Histology'. Next select 'chain' and 'gene', then click 'plot' to get the result. It is important to note that,when the "β chain" or "δ chain" is selected, in the form - gene, the corresponding D gene needs to be selected. And when "α chain" or "γ chain" is selected, the "NONE" in the form - gene needs to be selected. Only in the above cases can valid data be obtained.
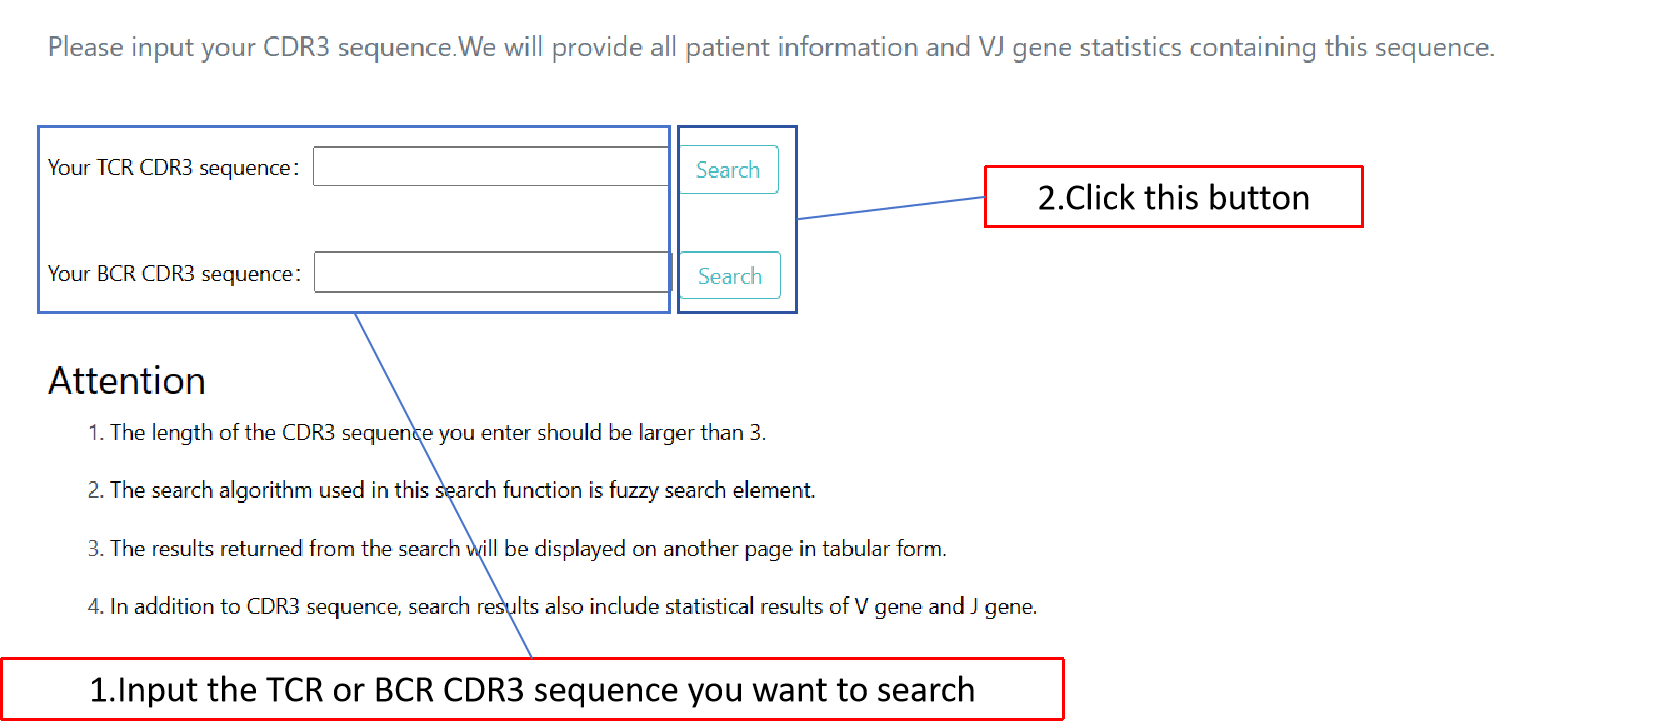
Search
The search module can fuzzy match the CDR3 sequence you input to the sequence in the database and obtain query results and statistical charts of some genes.
Result